To open the detail view of an 8D report, follow this path:
Navigation bar → QM → 8D reports → Click on the number of the desired 8D report
If required, use the search function to find a specific 8D report quickly and precisely.
Note: The exact names of the menu items may vary depending on the configuration of your LDB. Only areas that contain data or are enabled for you are displayed.
The detail view clearly summarizes all essential information of an 8D report. It allows you to:
Note: All texts highlighted in blue are clickable links to the respective data types. Some areas and functions are always available, others depend on your permissions and the configuration of your LDB. The names may also depend on the configuration.
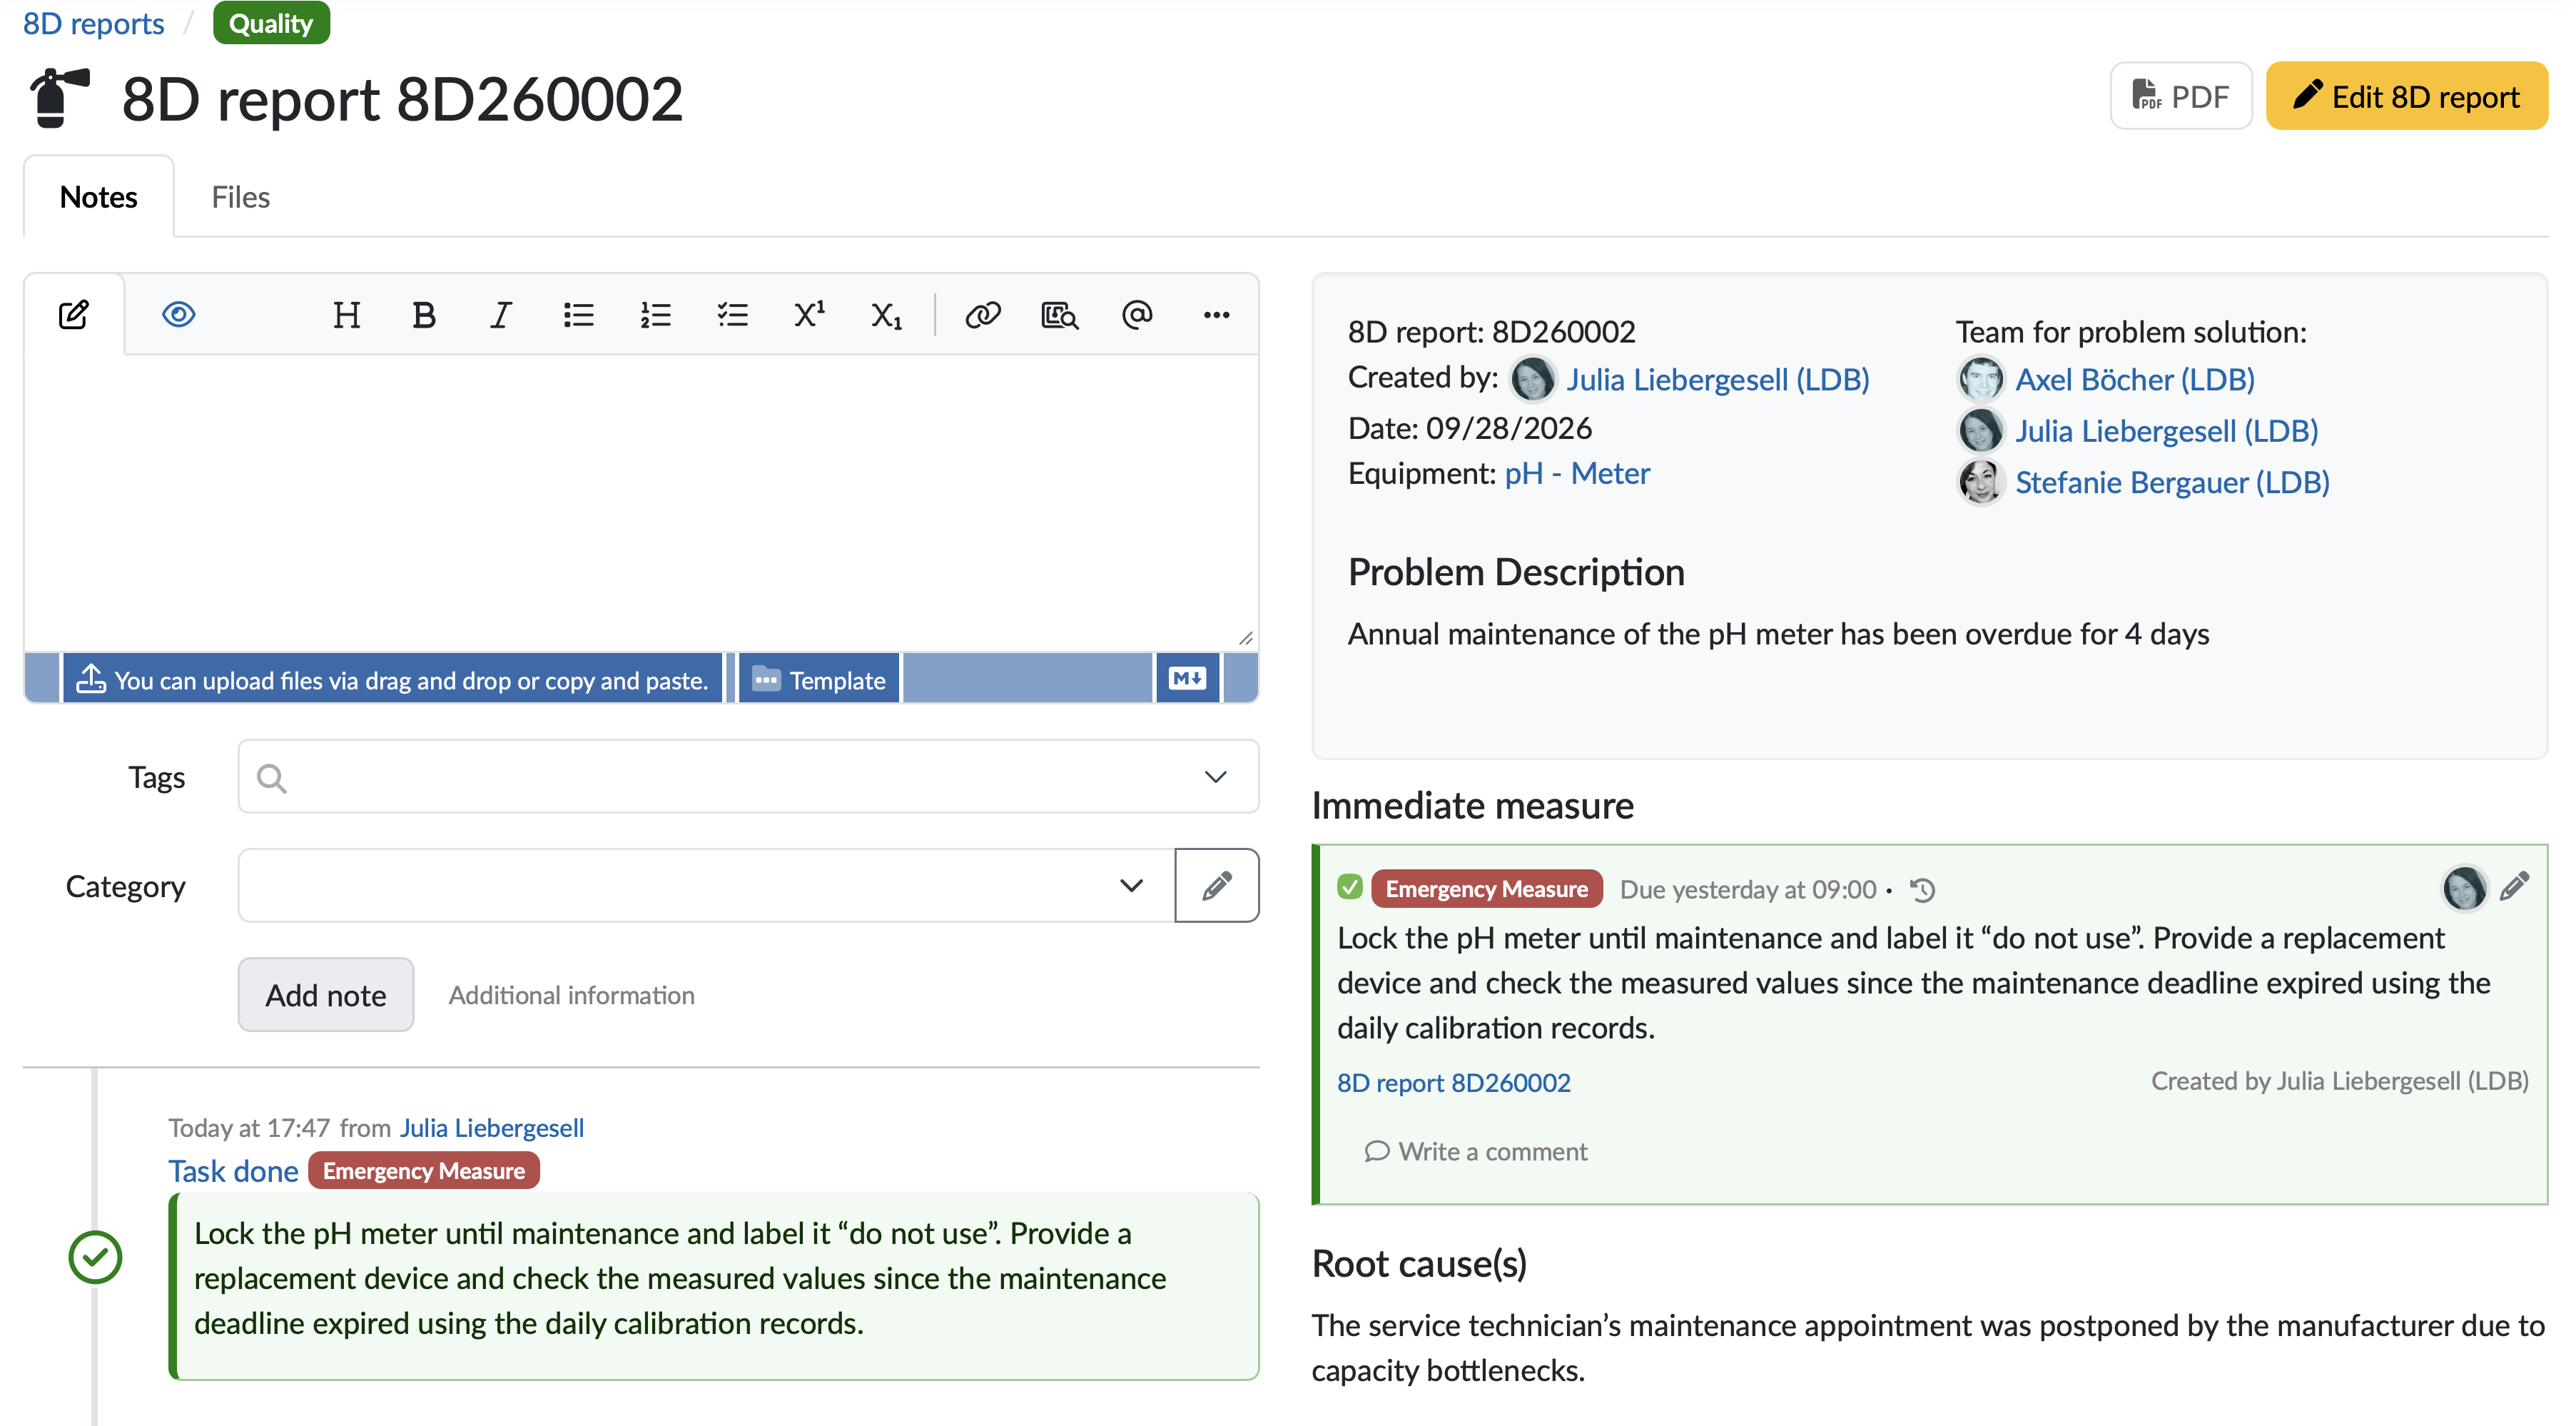
Figure: Detail view of an 8D report (tab Notes active)
In the header area, you see the number of the 8D report (e.g. 8D report 8D260001).
The tab menu is located below the header area. Use the tabs to switch between the data areas belonging to the 8D report. The small number (badge) on a tab shows the number of existing entries (e.g. Files 1).
| Tab | Description |
|---|---|
| Notes | Shows all notes and uploaded files of the 8D report in chronological order. This is where you add new notes. |
| Files | Shows all files uploaded to the 8D report. This is where you can upload further files. Uploading is only possible with the appropriate permission. |
The content area shows the content of the selected tab. The active tab is highlighted.
Content area tab Notes:
Content area tab Files:
Our recommendation: Upload evidence such as test reports or manufacturer letters directly to the 8D report. This way, the implementation of the measures can be traced at any time during audits.
To the right of the content area, the master data of the 8D report and – depending on the configuration and existing data – additional areas are displayed.
| Information | Description |
|---|---|
| Tags | Shows the tags assigned to the 8D report. Only displayed if tags have been assigned. |
| 8D report | Shows the number of the 8D report. |
| Created by | Shows the employee who created the 8D report. The name highlighted in blue is a link to the employee. |
| Date | Shows the date of the 8D report. |
| Associated data records | Shows the linked data records, e.g. Equipment, Material, Order or Customer. The names highlighted in blue are links to the respective data records. Only linked data records are displayed. |
| Team for problem solution | Shows the employees assigned to the 8D team, with profile picture and name. |
| Problem Description | Shows the description of the problem. |
Note: Depending on the data and configuration, further information may be displayed, e.g. configured master data fields.
Below the master data, the measures of the 8D report are displayed as tasks, together with the root cause(s).
Each task shows the type of measure as a colored tag (e.g. Emergency Measure or Corrective Action), the due date, the responsible employee, the description and the creator.
If an evaluation of the 8D report has been entered, it is displayed below the measures, supplemented by configured master data fields for the evaluation if applicable.
Once the 8D report is completed, a note highlighted in green appears at the bottom with the completion date and the employee who completed the 8D report.

Figure: Edit 8D report
Further information: Create / Edit 8D Report
Last change: 10/14/26
General information
8D-report
Supplier evaluation
Material
Employees
Customers
Orders
Samples
PDF templates
Assets
Recipes
Reports
Report table editor
Interfaces
AI functions
Introductory phase
Query reports
Templates
Client zone (optional)
Offers
Invoices
Parameters
Calculating with parameters
Webservices
Transformationscode
Test plans / limit values / specifications
Documents control
Questions and answers
Equipment
Trainings
Others
File management
Processes