Create/edit/delete a report table
Navigation
To create, edit, or delete a report table, go to:
Navigation bar → Settings → Report Table Editor
Create a new report table
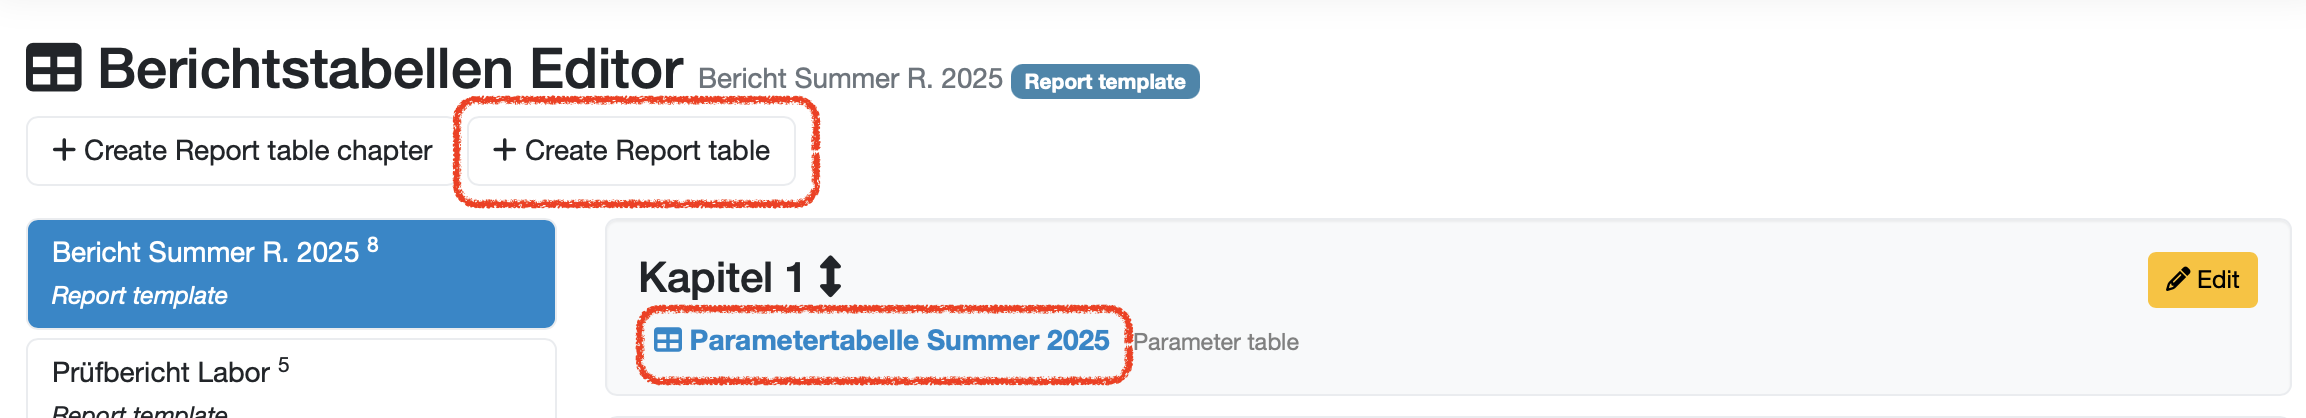
- Click on + Create report table. You will find this button in the left section of the page below the menu heading.
Edit report table
- Click on the relevant report table in the left section of the page.
- Then click on the blue name of the report table in the right section of the page.
Delete report table
- Click on the relevant report template in the left section of the page.
- Then click on the blue name of the report table in the right section of the page.
- Click on Delete at the bottom of the page.
Overview of report table editing
This comprehensive editing page allows you to fully configure report tables for PDF reports. Using the example of the “Summer 2025 parameter table,” all setting options for layout, content, and formatting are shown.

Basic settings for the report table
Note: Use a second browser window in which you have opened the PDF report and track your changes to the report table here.
Table master data
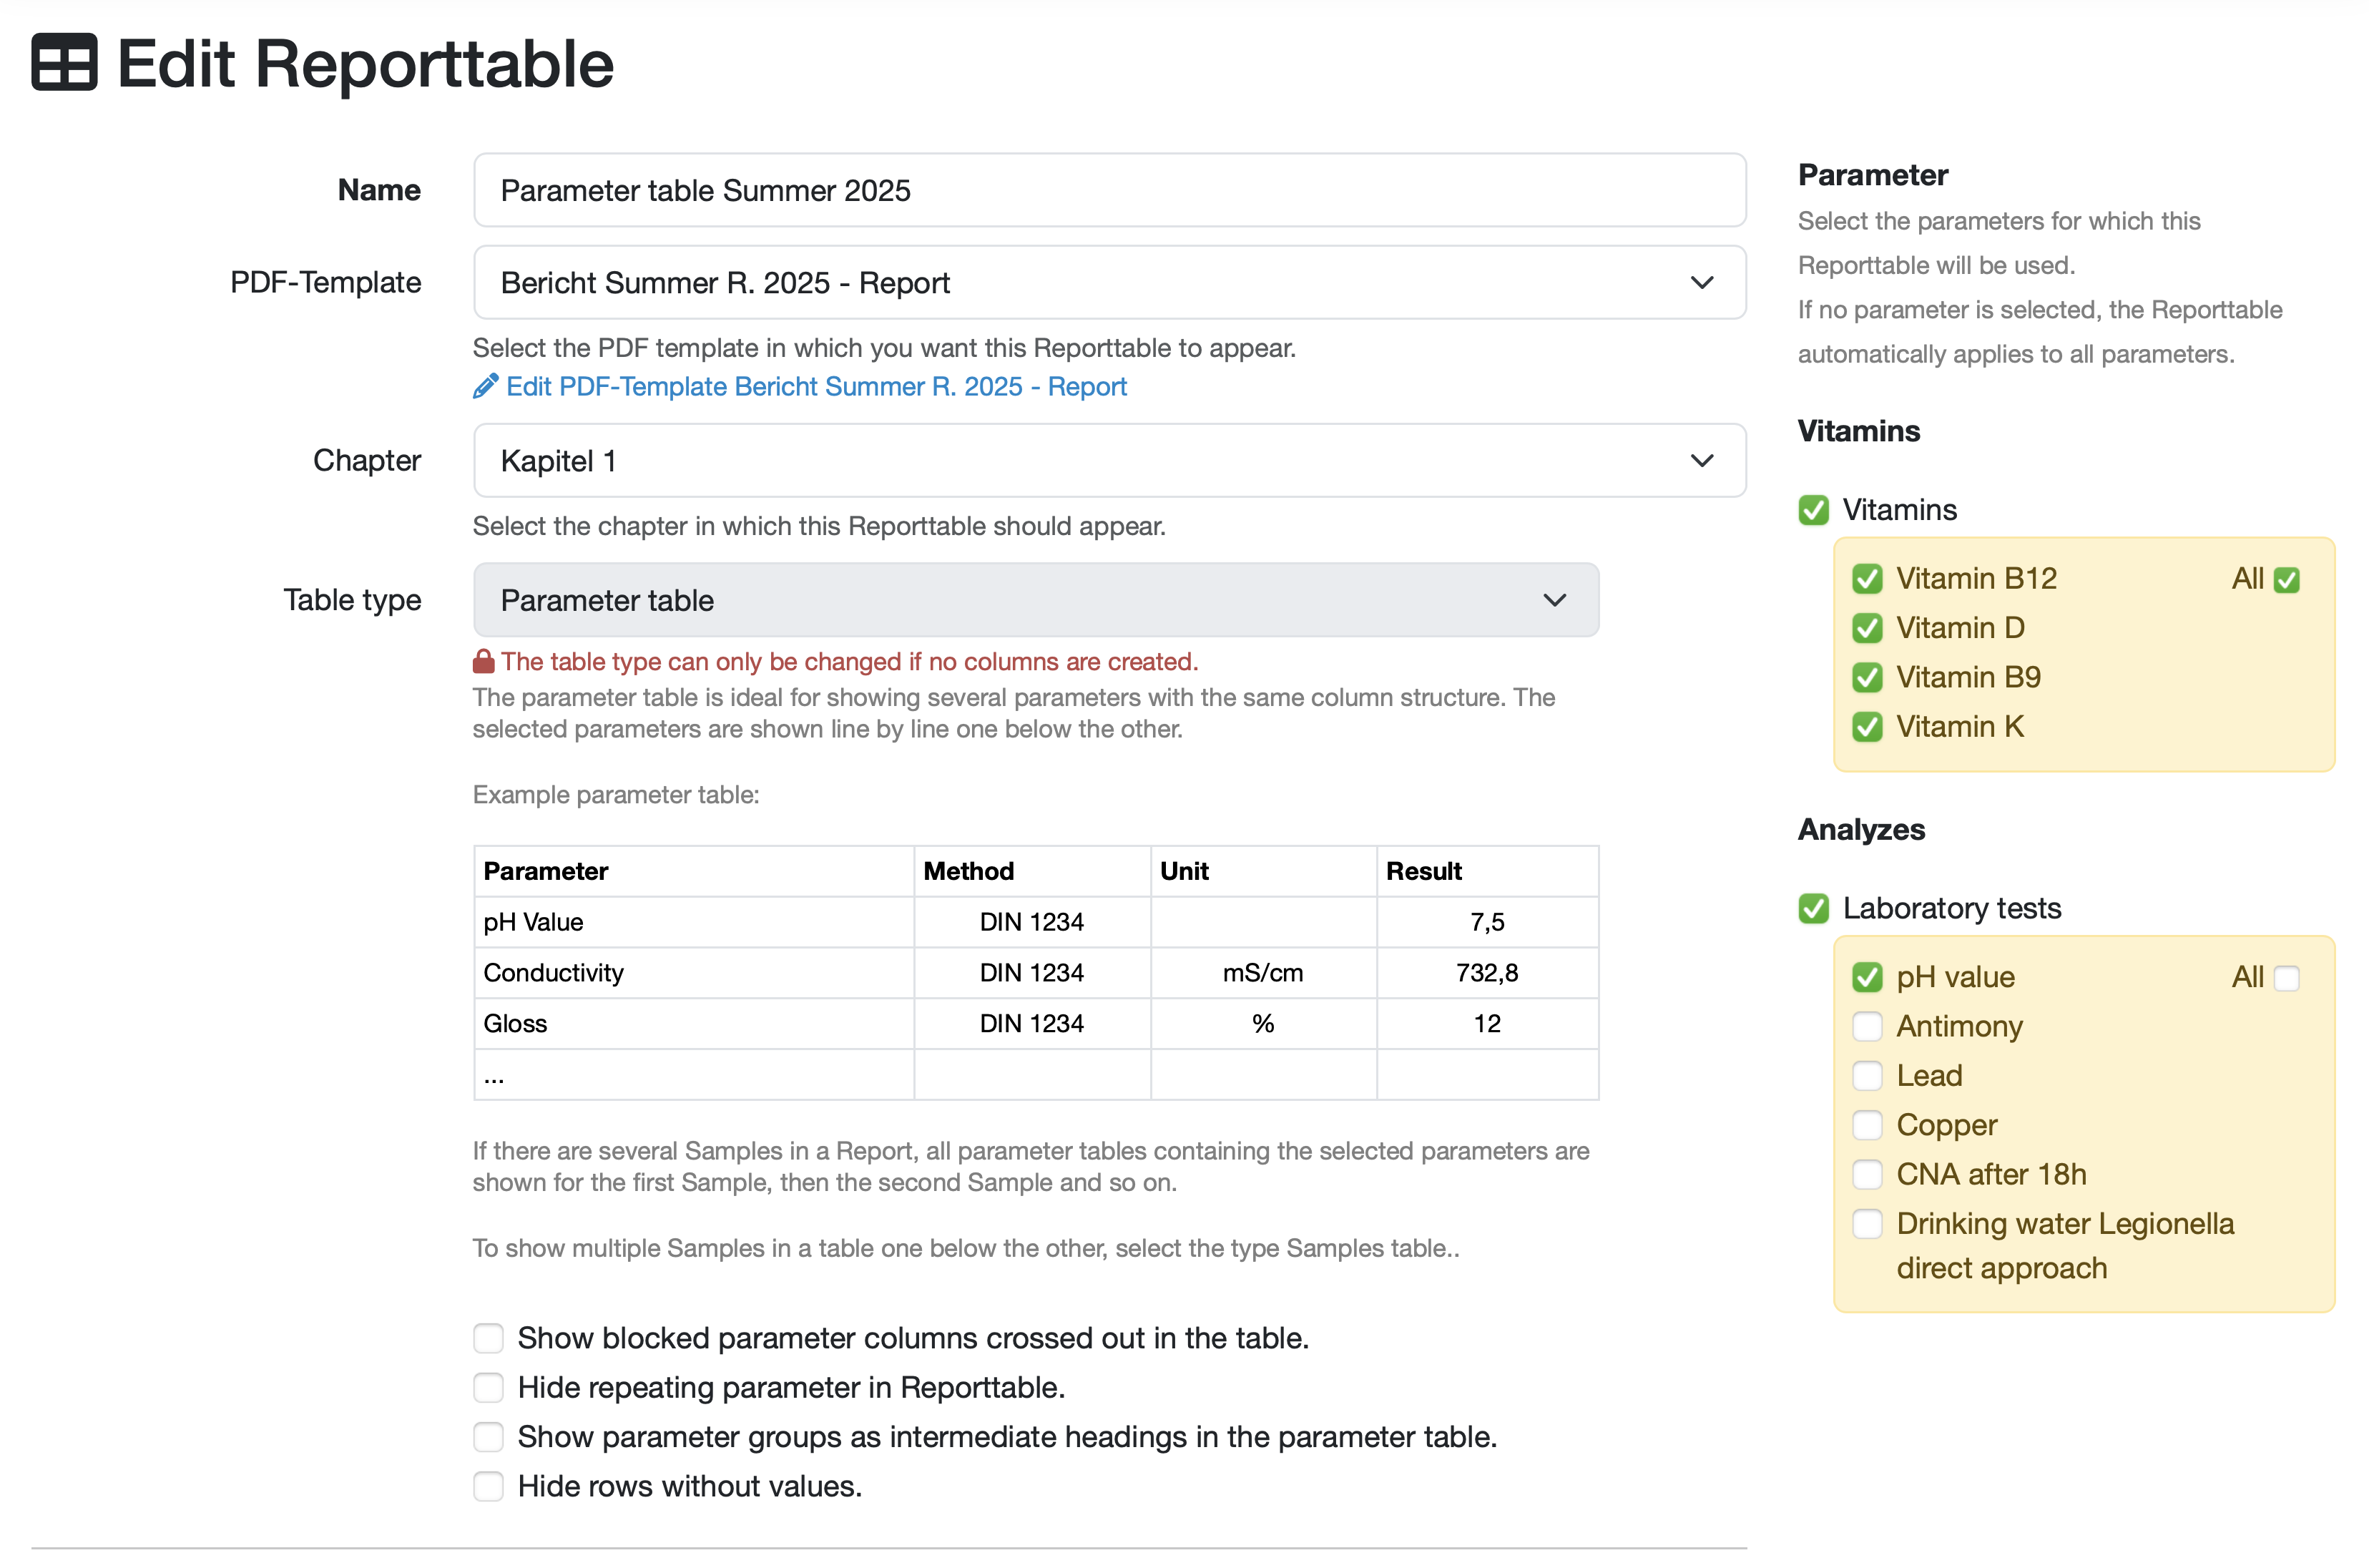
In the configuration area of the table master data, you can specify, among other things, which PDF template the table is relevant for and assign a chapter to determine where the report table should appear in the final document.
Configuration:
- Customize name: Use meaningful names, Parameter table summer 2025
- Select PDF template: Specify the target report template, Report summer R. 2025 - Report
Edit link in blue: PDF template Summer R. 2025 report - Edit report
Note: Select the PDF template in which this report table should appear. - Assign chapter: Optional for better structuring, Chapter 1
Note: Select the chapter in which this report table should appear. The chapters are only available for selection if the previously selected PDF template has been saved and the chapters are assigned to this PDF template.
Table types
Different table types are designed to enable the optimal presentation of your results.
Table types at a glance:
Parameter table - for displaying multiple parameters with the same column structure. The selected parameters are displayed row by row.
Sample table - to display master data of samples and/or a few parameters (< 5) side by side.
The samples are displayed in rows one below the other.
Open table structure - allows you to design any table structure.
To do this, the content for each individual cell in each row must be defined (no rows are inserted dynamically).
Parameter images - to display images that have been stored for a parameter in a sample. All parameters selected for the report table are taken into account.
Parameter table for multiple samples - to display multiple parameters with the same column structure. The selected parameters are displayed row by row. Furthermore, up to five samples can be displayed as columns.
Configuration:
- Select table type (dropdown selection): “Parameter table”
- Select relevant parameters: Use the checkboxes to select the parameters for which this report table will be used. If no parameters are selected, the report table will automatically apply to all parameters.
- Note: The table type can only be changed if no columns have been created.
Sample parameter table
A sample table shows the structure with parameters such as pH value (7.5), conductivity (732.8 mS/cm), and loss on ignition (12%) according to DIN 1234 method.
Table behavior options
Special display options
Depending on your needs, the special display options can be activated via checkboxes to structure the results display and make it transparent.
Configuration:
To activate the respective function, check the corresponding box.
- Show blocked parameter columns in the table crossed out.
- Hide parameter repetitions in the report table.
- Display parameter groups as subheadings in the parameter table.
- Hide rows without values.
Conditional display
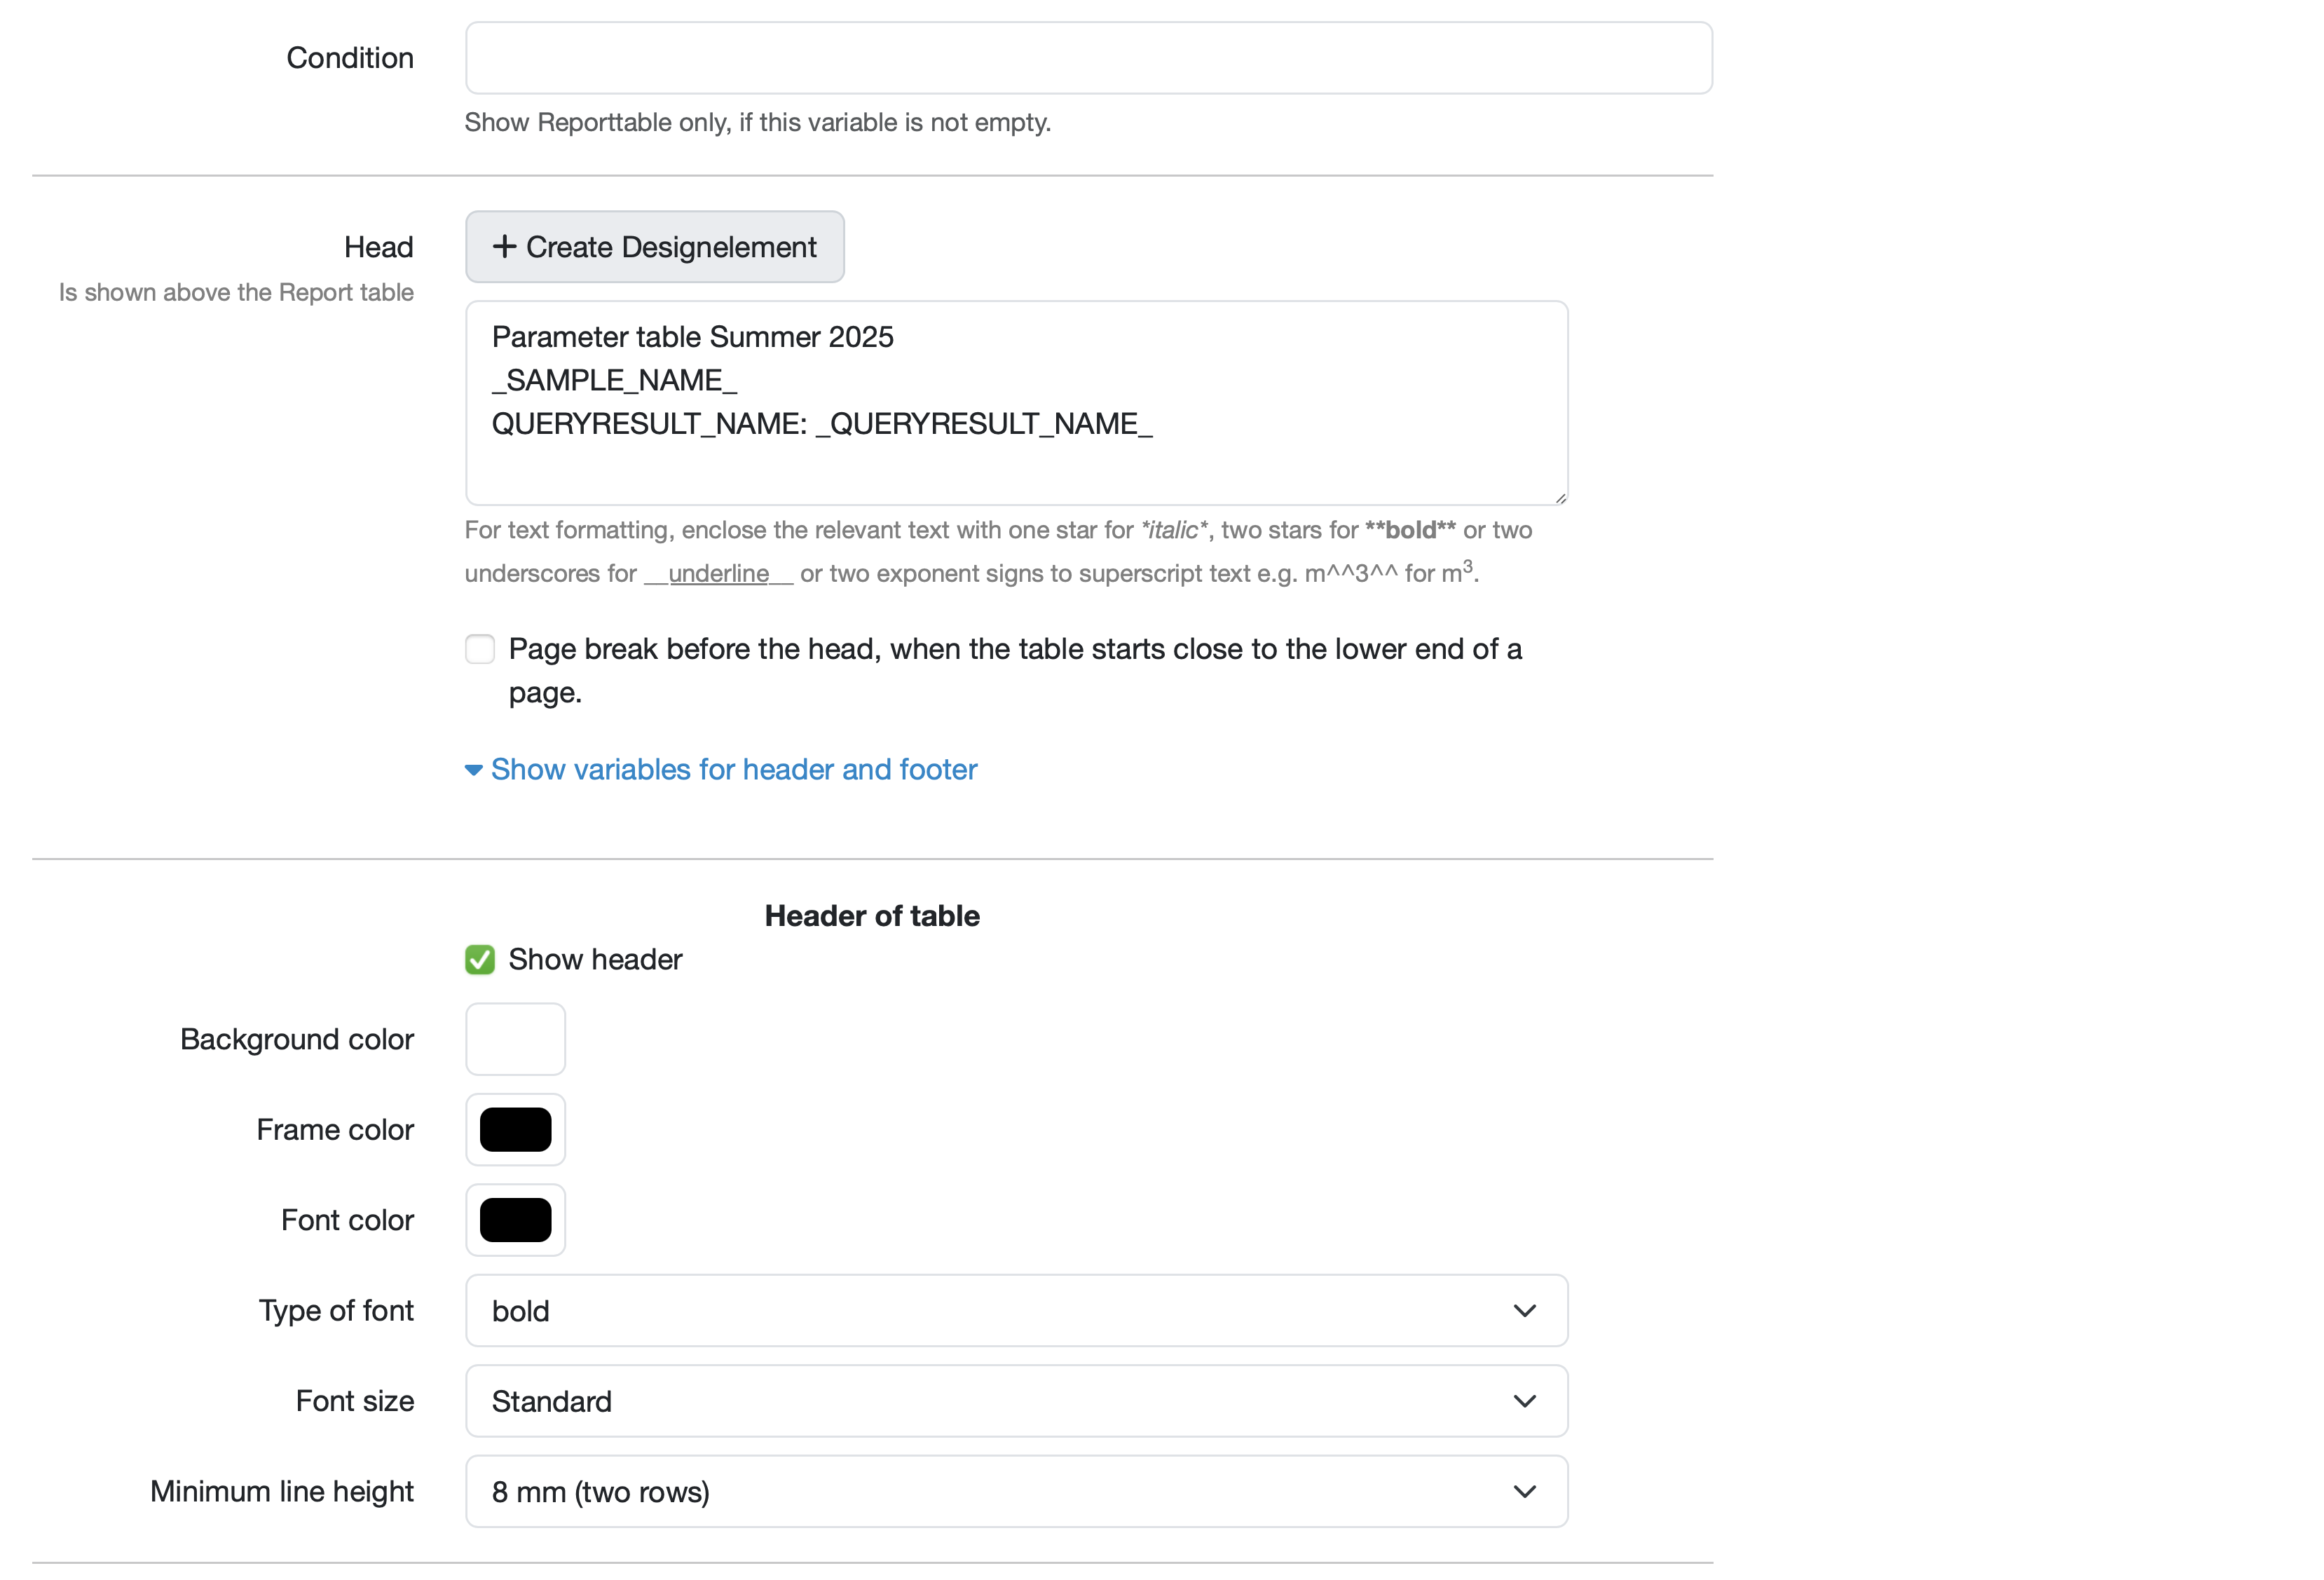
Specially defined additional conditions control under which circumstances the report table is displayed in the report.
Configuration:
- Condition: Text field for entering the defined display conditions
Designing the header area of the table
Defining header content
The table header appears above the report table and, like the table header row, can be optionally displayed in the report. For additional information, further elements can be added to the header area and different layout options can be used.
Configuration:
- + Create design element: Click the button to add individually configurable header elements.
- Enter table heading (text field): Fixed and dynamic content can be defined in the text field for the header. Dynamic content can be specified using variables and adapts automatically. The sample number is specified for each report using
SampleNAME_, for example. - Text formatting: For text formatting, enclose the relevant text as described below the text field for the header text.
- Page break before header if the table starts near the bottom of a page. (Checkbox): To activate, check the box.
- Show variables for header and footer (button for folding in/out): to see the variables available by default and use them as table headers or in design elements
- Show header (checkbox): To activate, place a check mark in the checkbox.
Formatting options for header and main section (tables - content)
In addition to the standard default settings, formatting options are available to highlight and distinguish the contents of the table.
Configuration:
- Select colors (background, border, font)
- Select font type and font size for highlighting
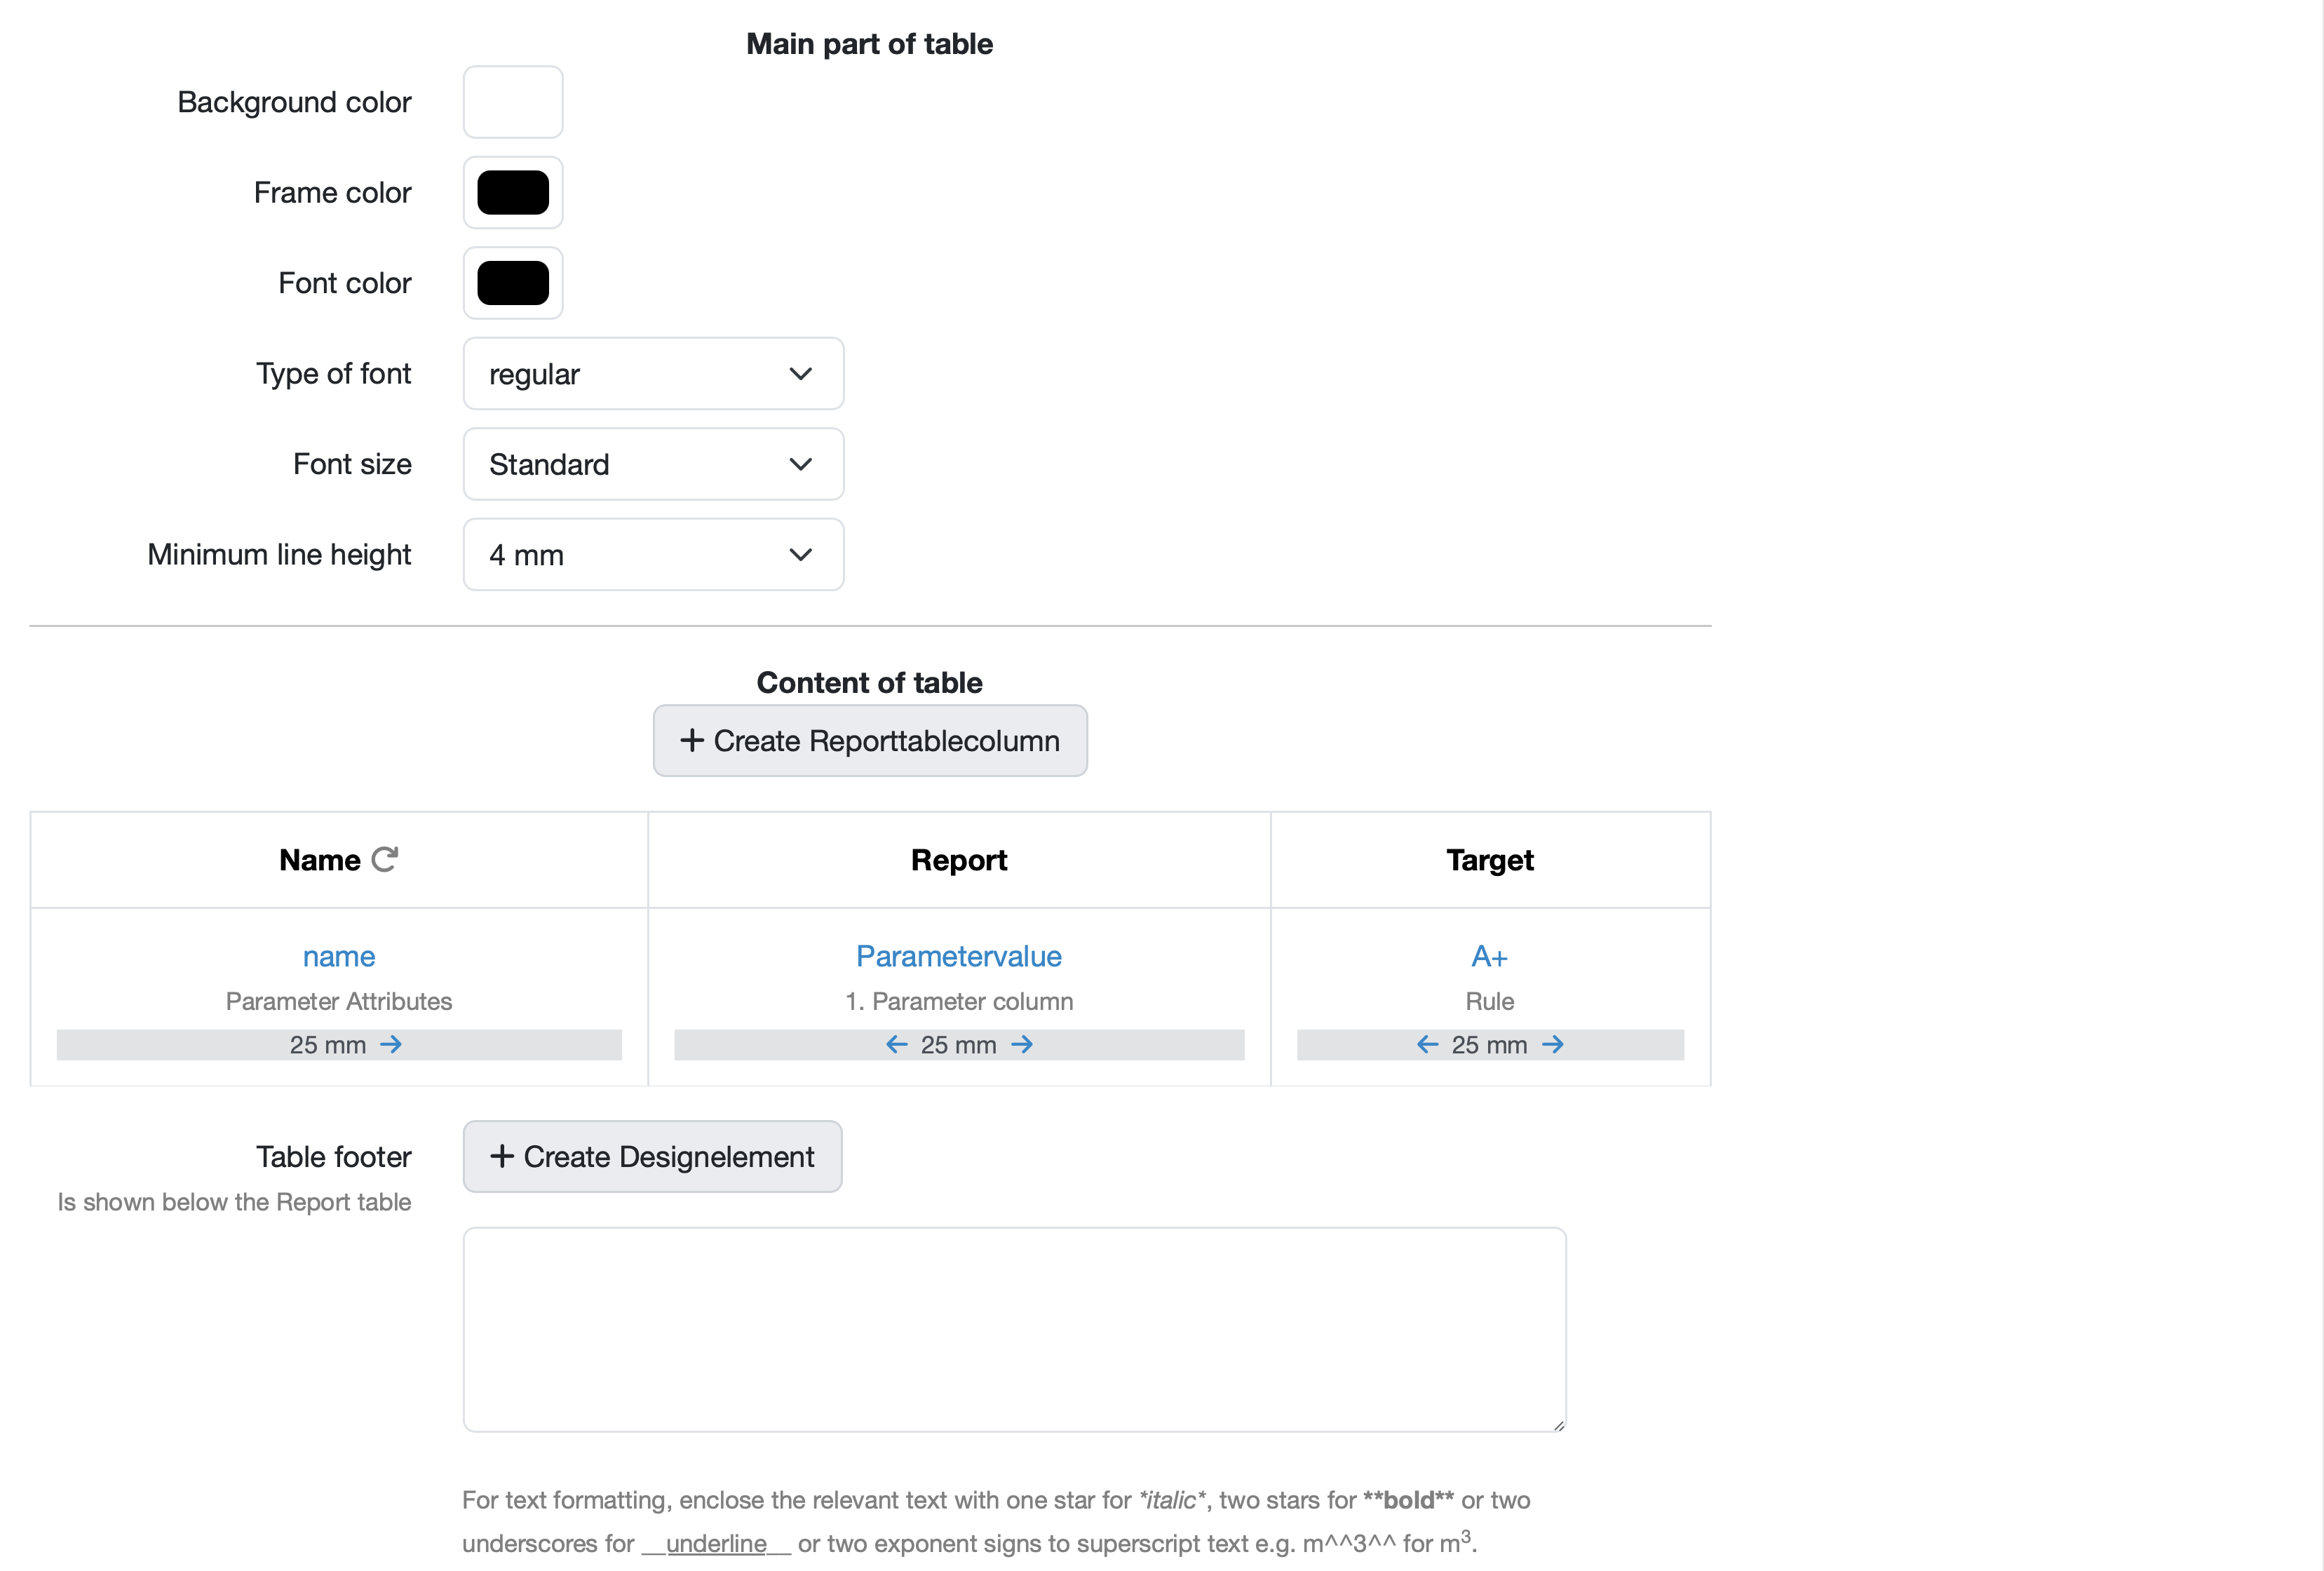
- Background color (color field): white
- Border color (color field): black
- Font color (color field): black
- Font type (dropdown): “bold” / ‘regular’
- Font size (dropdown): “Standard”
- Minimum line height (dropdown): “8 mm (two lines)” / “4 mm”
Define table content
Create columns
Table columns are defined in order to generate the table content. Depending on the table type, you have different data types and entries available for the table columns, which you can display in your report.
Configuration:
- + Create report table column: Click on the button to add a new column.
Define column content
The content is defined for each column.
The column content is composed of the selection of:
- Header text
- Data source (parameter, target value, result)
- Column width
- Text alignment
To change the order of the columns, use the right or left-pointing arrow arrows to change the position.
Configuration:
The sample table shows three existing columns configured as follows:
Column 1:
- Header: Name
- Value: “name” (blue link)
- Data type: “Parameter master data”
- Column width: “25 mm”
- Change order: Click on the right-facing arrow to move the column one position to the right
Column 2:
- Header: Target value
- Value: “Type A+”
- Data type: “Target value”
- Column width: “25 mm”
- Change order: Click on the right or left arrow to move the column one position to the right or left.
Column 3:
- Header: Value
- Value: “Parameter value” (blue link)
- Data type: “Contents of parameter column 1”
- Column width: “25 mm”
- Change order: Click on the left arrow to move the column one position to the left.
Define table footer
The table footer appears below the report table.
Configuration:
- + Create design element: Click the button to add individually configurable footer elements.
- Enter footer text: (text field): Fixed and dynamic content can be defined in the text field for the footer. Dynamic content can be specified using variables and adapts automatically. The sample number, for example, is specified for each report using sampleNAME_.
- Text formatting: For text formatting, enclose the relevant text as described below the text field for the footer text.
Parameter selection
In the right-hand section of the page, you will find all the parameters stored in the parameter management.
Configuration:
- Select parameters: Select the parameters for which this report table is used.
If no parameter is selected, the report table automatically applies to all parameters.
Action buttons
Save and management options
The save and management options are located at the bottom of the page.
- “Save”: Gray button. Applies all settings.
- “Copy”: Blue link. Creates a copy with all saved settings. (Image files are not copied.)
- “Delete”: Red link. Deletes the data record.
- “Cancel”: Red link. Discards all unsaved changes.
Operating steps
1. Make basic settings
- Assign a name: Use meaningful names.
- Select PDF template: Select the relevant PDF template.
- Assign chapter: Select the appropriate chapter of the PDF template.
- Select table type: Select the table type.
2. Set parameters (applies to the “Parameter table” table type)
- Specific parameters: Select individual parameters.
- “All” option: Use for comprehensive parameter groups.
- No selection: Without a selection, the table applies to all parameters.
3. Configure table layout
- Design header:
- Activate “Show header”
- Select colors (background, border, font)
- Set font type to “bold” for emphasis
- Format main section (table content):
- Configure font and font size.
- Specify minimum row height.
- Select border and background colors.
4. Create column structure
- New columns: Click “+ Create report table column”
- Column content: Define the following for each column:
- Header text
- Data source (parameter, target value, result)
- Column width
- Text alignment
- Order: Use the right or left-pointing arrows to position the columns.
5. Configure special options
- Display options: Select the desired checkboxes:
- Parameter groups as subheadings
- Hide rows without values
- Hide parameter repetitions
- Conditional display: Set predefined conditions for table visibility.
6. Add design elements
- Header design: Add additional header elements.
- Footer: Create table footers as needed.
- Page break: Configure the break behavior.
Last change: 07/13/26
General information
- Main menu
- Dashboard
- Backup / Data protection
- Version number of the LDB
- Supported browsers
- Activation of SSO
- Print labels
- Automatic LDB validations
- Create/Edit/Delete Categories
- Status management
- SMTP Configuration
- Konfiguration SMTP via OAuth 2.0
- IT requirements for the use of the Labordatenbank
- Add Dashboard Widgets
- Evaluation criteria for suppliers
- Edit evaluation criteria for suppliers
- Restore Deleted Records
- Email informations
- Vacation days
- Manage Weekly Hours
- Manage materials
- Onlineorder detailview
- Manage orders
- Edit orders
- Edit process key figures
- Create process key figures
- Manage 8D-Reports
- Process management view editing
- Edit processes
- Manage Projects
- Edit projects
- Edit planned order
- Edit planned samples
- Tag management
Samples
- Manage samples
- Add/Edit/Delete samples
- Enter values
- Results table
- Charts and Statistical Key Figures
- Manage Filters
- Edit - Search Filters and Column Filters
- Map pooled samples in LIMS
- Manage Stations
- Create / edit / delete station
- Book samples into a station
PDF templates
- Manage PDF Templates
- Create/edit PDF templates
- Create design elements
- Design elements Setting options
- Integrate report tables into PDF template
- Design element for the reason for reissuing test reports
- PDF template for sample labels
Employees
- Manage employees
- Add/edit/archive employee
- Manage employee groups
- Edit employee group
- Create task
- Audit Trail: traceable documentation of all work
- Access rights
- Edit Accessright
- Time tracking - Create hours entry
- Time tracking - Hours per day
- Time tracking - Hours per week
- Time tracking - Annual overview
- Labordatenbank Login / Logout
- Change password
- activate Multi-Factor-Authentification (MFA) with TOTP
- activate a Security Key for the MFA
- Activation of Passkey
- Install TOTP App
- Import employees (introduction phase)
Assets
- Manage assets
- Add/edit/archive asset
- Add subassets to asset
- Add Planned Order and Sample
- Add tests to order templates
- Copy assets, order templates, and asset components
- Equipment GPS location
- Add on-site inspection
Recipes
- Manage recipes
- Create/edit recipe
- Recipe detail view and ingredients
- Quality assurance for recipes: testing, evaluating, documenting
Reports
- Create report
- Inserting Images and File Attachments into a Report
- Sign reports
- Request signature
- Reissue of signed reports
- Send reports by e-mail or post
- Protect emails from spam filters
- Verify authenticity of reports and certificates
- Certificate
- Manage signatures
- Create / edit / delete a signature
Report table editor
- Create/edit/delete a report table
- Create / Edit reporttable column
- Creating a parameter table with target values
- Create sample table
- Create table with open structure
- Order of the report tables
- Fonts and character set for PDF reports
- Report tables overview
- Create checklist with report table editor
- Measurement repetitions value selection
Interfaces
- Import Interfaces Overview
- AI Extension for Import Interfaces
- Edit Attributes in Import Mapping
- Import results from measuring instruments
- Create CSV measurement data import interface
- Import measurement data
- Import of samples
- Mode for measured value import
- Automatic FTP/SFTP Import
- Test SFTP/FTP Connection
- Testing the HTTPS Import Interface
- Transformation code for importing other data formats
- Practical example: Import GC/MS measurement values to your LIMS system
- Practical example: Import Biomerieux Vitek antibiogram into LIMS
- Connect Thermo Fisher Chromeleon to LIMS
- Connect PCR to LIMS with plate assignment
- LIMS connection to DEMIS reporting for pathogen detection
- Tips for import interfaces
- Imort pictures in parameters
- Connection of Essentim data loggers
- SHAPTH - Drinking water database report transmission
Kompetenzen
AI functions
- Enable/disable AI integration
- AI Explorer
- Query Explorer
- AI Import: Automatically assign external calibration certificates
- Enable and Use Audit Assistant
Introductory phase
- Labordatenbank introduction checklist
- Labordatenbank data structure
- Implementing the QM-Database
- Import parameters (Introduction phase)
- Import sample master data (Introduction phase)
- Benefits of the LDB Cloud
- configurable master data fields in the LDB
- Transfer files securely to the LDB
Query reports
- Create query reports using a template
- SQL Basic Course
- SQL JOINs
- SQL Basics
- Create / Edit query reports
- Parameter columns
- Variables in query reports
- Export data from query reports
- Link Evaluations
- Query report tables (SQL table and SQL bar chart)
- Save and Display MySQL Backup Locally
- Link evaluations with import interface
Orders
- Create Order
- Add an order using a template
- Add samples with an order template
- Delete order
- Scanning and sending documents to the LDB with QR
- Typical configurations
- Create order templates
- Create orders using templates
- Defining order access rights
- Order schedule
Templates
- Manage templates for samples
- Create/Edit/Add Sample template
- Templates for orders, customers, materials, and other data types
Customers
- E-mail templates for reports and invoices
- Create customer
- Add / Edit / Delete contact persons at customers
- Merging duplicate customers
- Search customers
- Forward emails to the LDB
- Import customers ( introduction phase)
- Delete Customer
Client zone (optional)
Offers
- Create offer
- Add prices and price items
- Appendix with Terms and Conditions and Service Catalog
- Send Offer
Invoices
- Manage invoices
- Create Invoice
- Sending Invoices
- The English translation for "Teilzahlungen bei einer Rechnung erfassen
- Manage price list
- Exporting invoices
- Import billing items (Introduction phase)
- Create revenue centers for prices
- Activate X-invoice / E-invoice for Germany
- Create Collective Invoices
- Cancel invoice
- QR code for online banking on invoices
- Suggest billing items
Parameters
- Parameter management
- Add/Edit/Delete Parameter
- Create/edit/delete parameter group
- Daily Parameter List: What has to be done in the laboratory
- Parameter usage statistics
- Labeling of subcontracting and accreditation
- Parameter data types
- portray proficiency tests
- Manage examination packages
- Create/Edit examination packages
Calculating with parameters
- Deposit formulas with parameters
- Calculating with number sequences
- Calculation of dry matter and annealing loss
- Calculating with Date/Time Information
- Example: Weighing in and weighing out
- Example: Calculation of annealing loss with validity check
- Example: Determination of Chemical Oxygen Demand
- Example: Determination of TVC - aerobic mesophilic total viable count
- Bsp.: Drinkingwater-Legionella since March 2023 (German Regulation)
Webservices
- LDB Webservices
- Provide data as web services for external systems
- Send data to an external web service
- Send data to the Labordatenbank
- Example: Send eTermin to the LDB
- Example: JSON file for creating samples
Transformationscode
- General structure of a transformation code
- Transformation code for evaluations
- Export transformation code
- Webservice Response Handler
- Import transformation code
Test plans / limit values / specifications
- Create test plan / limit value table / specification
- Add specification limits / reference ranges
- Measurement value evaluation based on reference range values
- Detect and filter reference range deviations
- Parameter-specific text modules according to limit tables
Documents control
- Create a New Document
- Create new version
- Validate document
- Release Document
- Request read confirmation
- Import documents (Introduction phase)
- Change the document creator afterwards
- Delete documents
- Documents: Confirm validity check
Material
- Functions of Material Management
- Create/edit/delete material
- Linking materials with parameters
- Reorder Materials Online
- Management of chemicals
- Manage/Create/Edit/Delete Batches
- Use batch samples
Questions and answers
- IT requirements
- Where can I find the current version number of the _LABORDATENBANK__?
- How can I calculate the average from five measured values?
- Where do you enter titles like Dr/Prof/Dipl. etc.?
- How can I change the order of parameters in the packages?
- Querious: Delete archived reports
- Download files in the Edge browser instead of opening them directly
- Transfer the status of the production system to the test system
Equipment
- Test Equipment Management
- Test equipment detailed view
- Add/edit/delete Test Equipment
- Import test equipment (introduction phase)
- Create control charts
- Import control values from test equipment
- Print labels for test equipment
- Forward emails to test equipment
- Booking Test Equipment
- Test Equipment Calendar
Trainings
- TrainingSchedule: Document Training Sessions, Demonstrate Competencies
- Add/edit/delete training
- Import Trainings (Introduction phase)
8D-report
Others
Supplier evaluation
File management
- Add Files (to Samples, Customers, Orders)
- Add Files (Test Equipment, Material, Batches, Specifications)
- File Management
- Search data
Processes