Creating a parameter table with target values
The following describes how to create the table shown here:
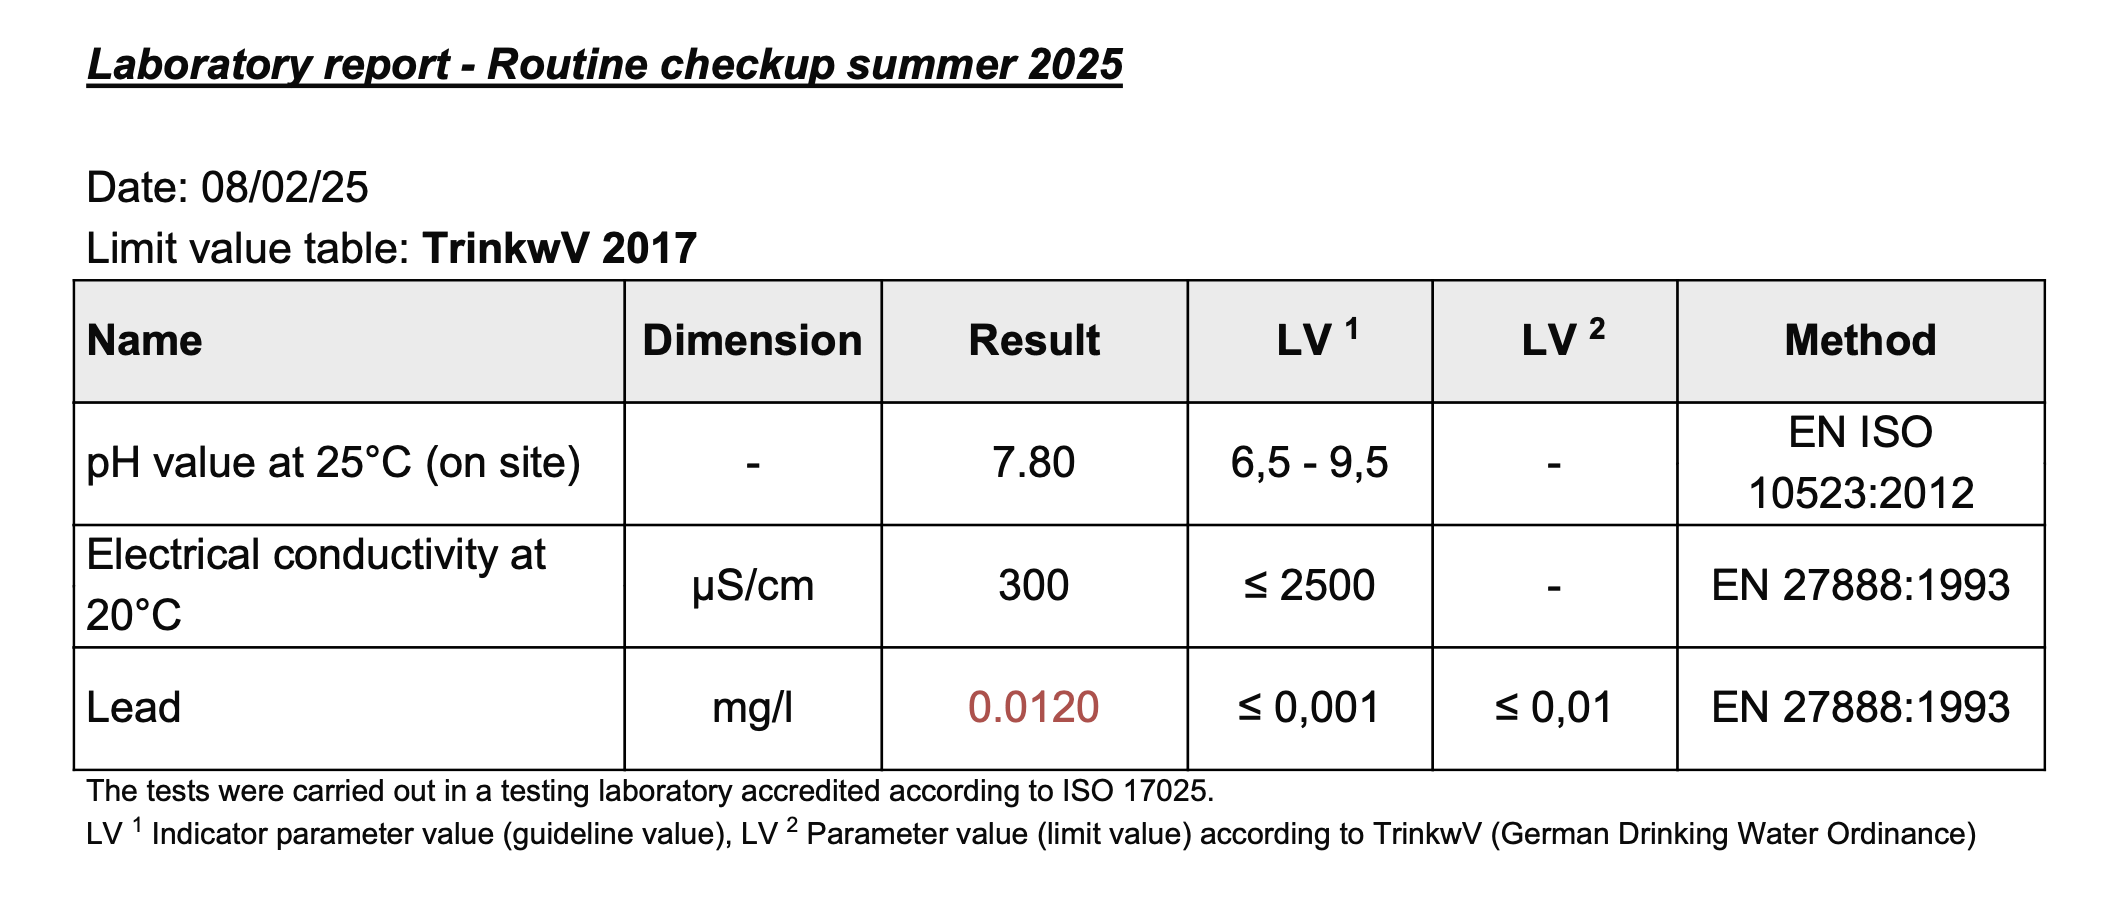
-
Create the table in the Report Table Editor. (See instructions: Create/edit/delete a report table)
Select Parameter Table as type of table. -
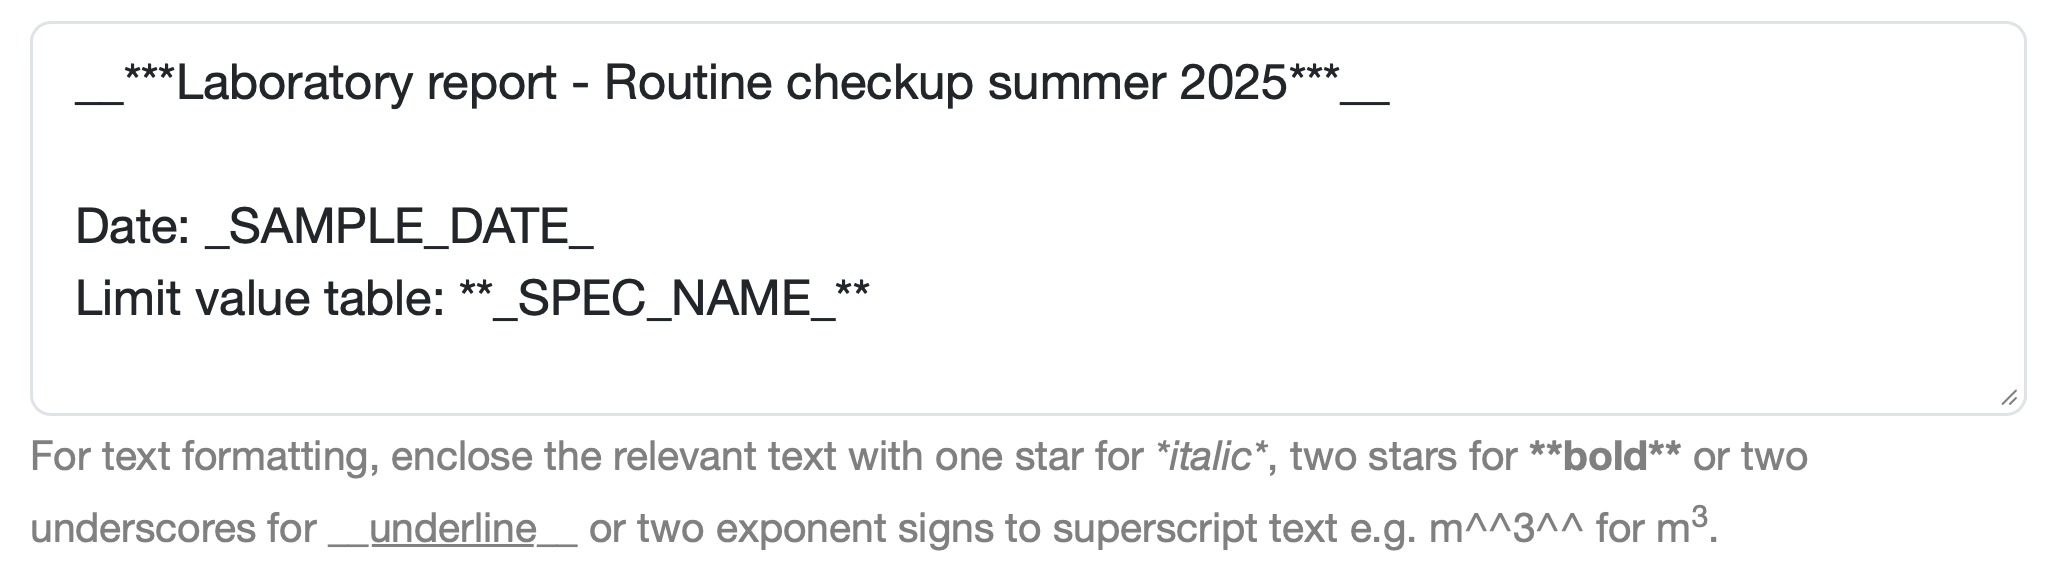
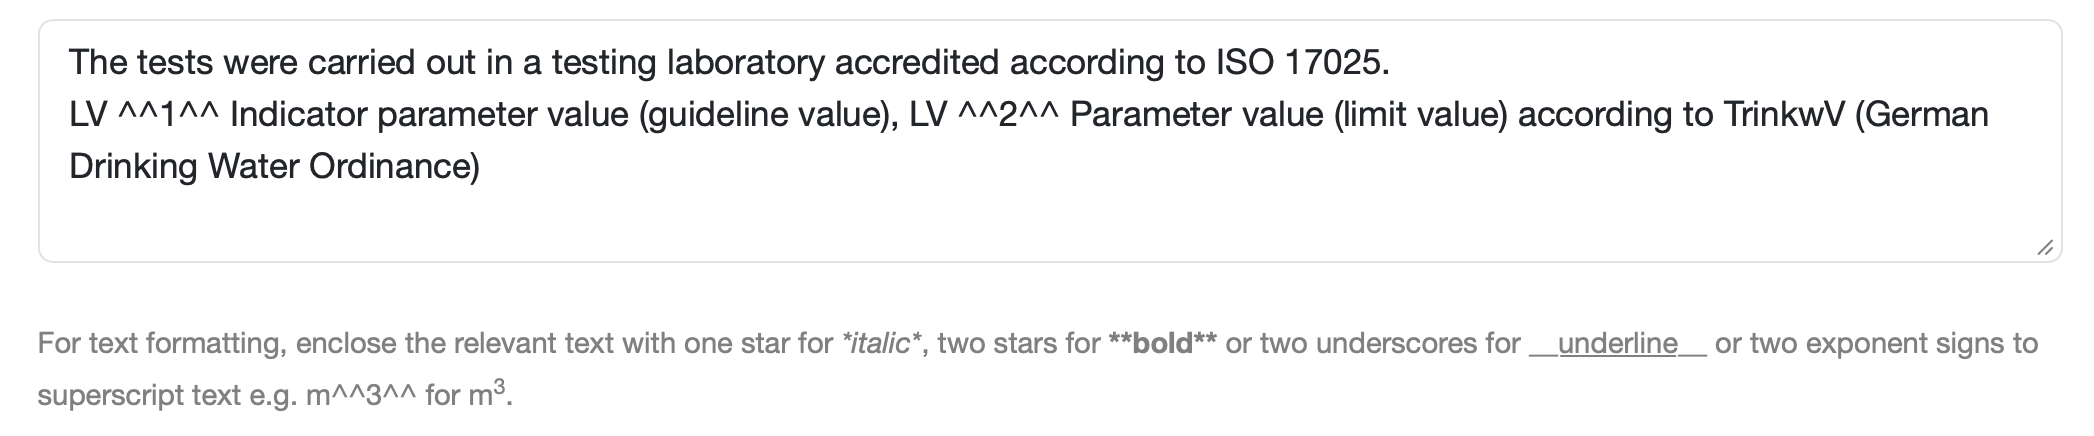
Enter the text for the Header.
Highlight the head by surrounding the text with one asterisk each for italic and two more asterisks each for bold.
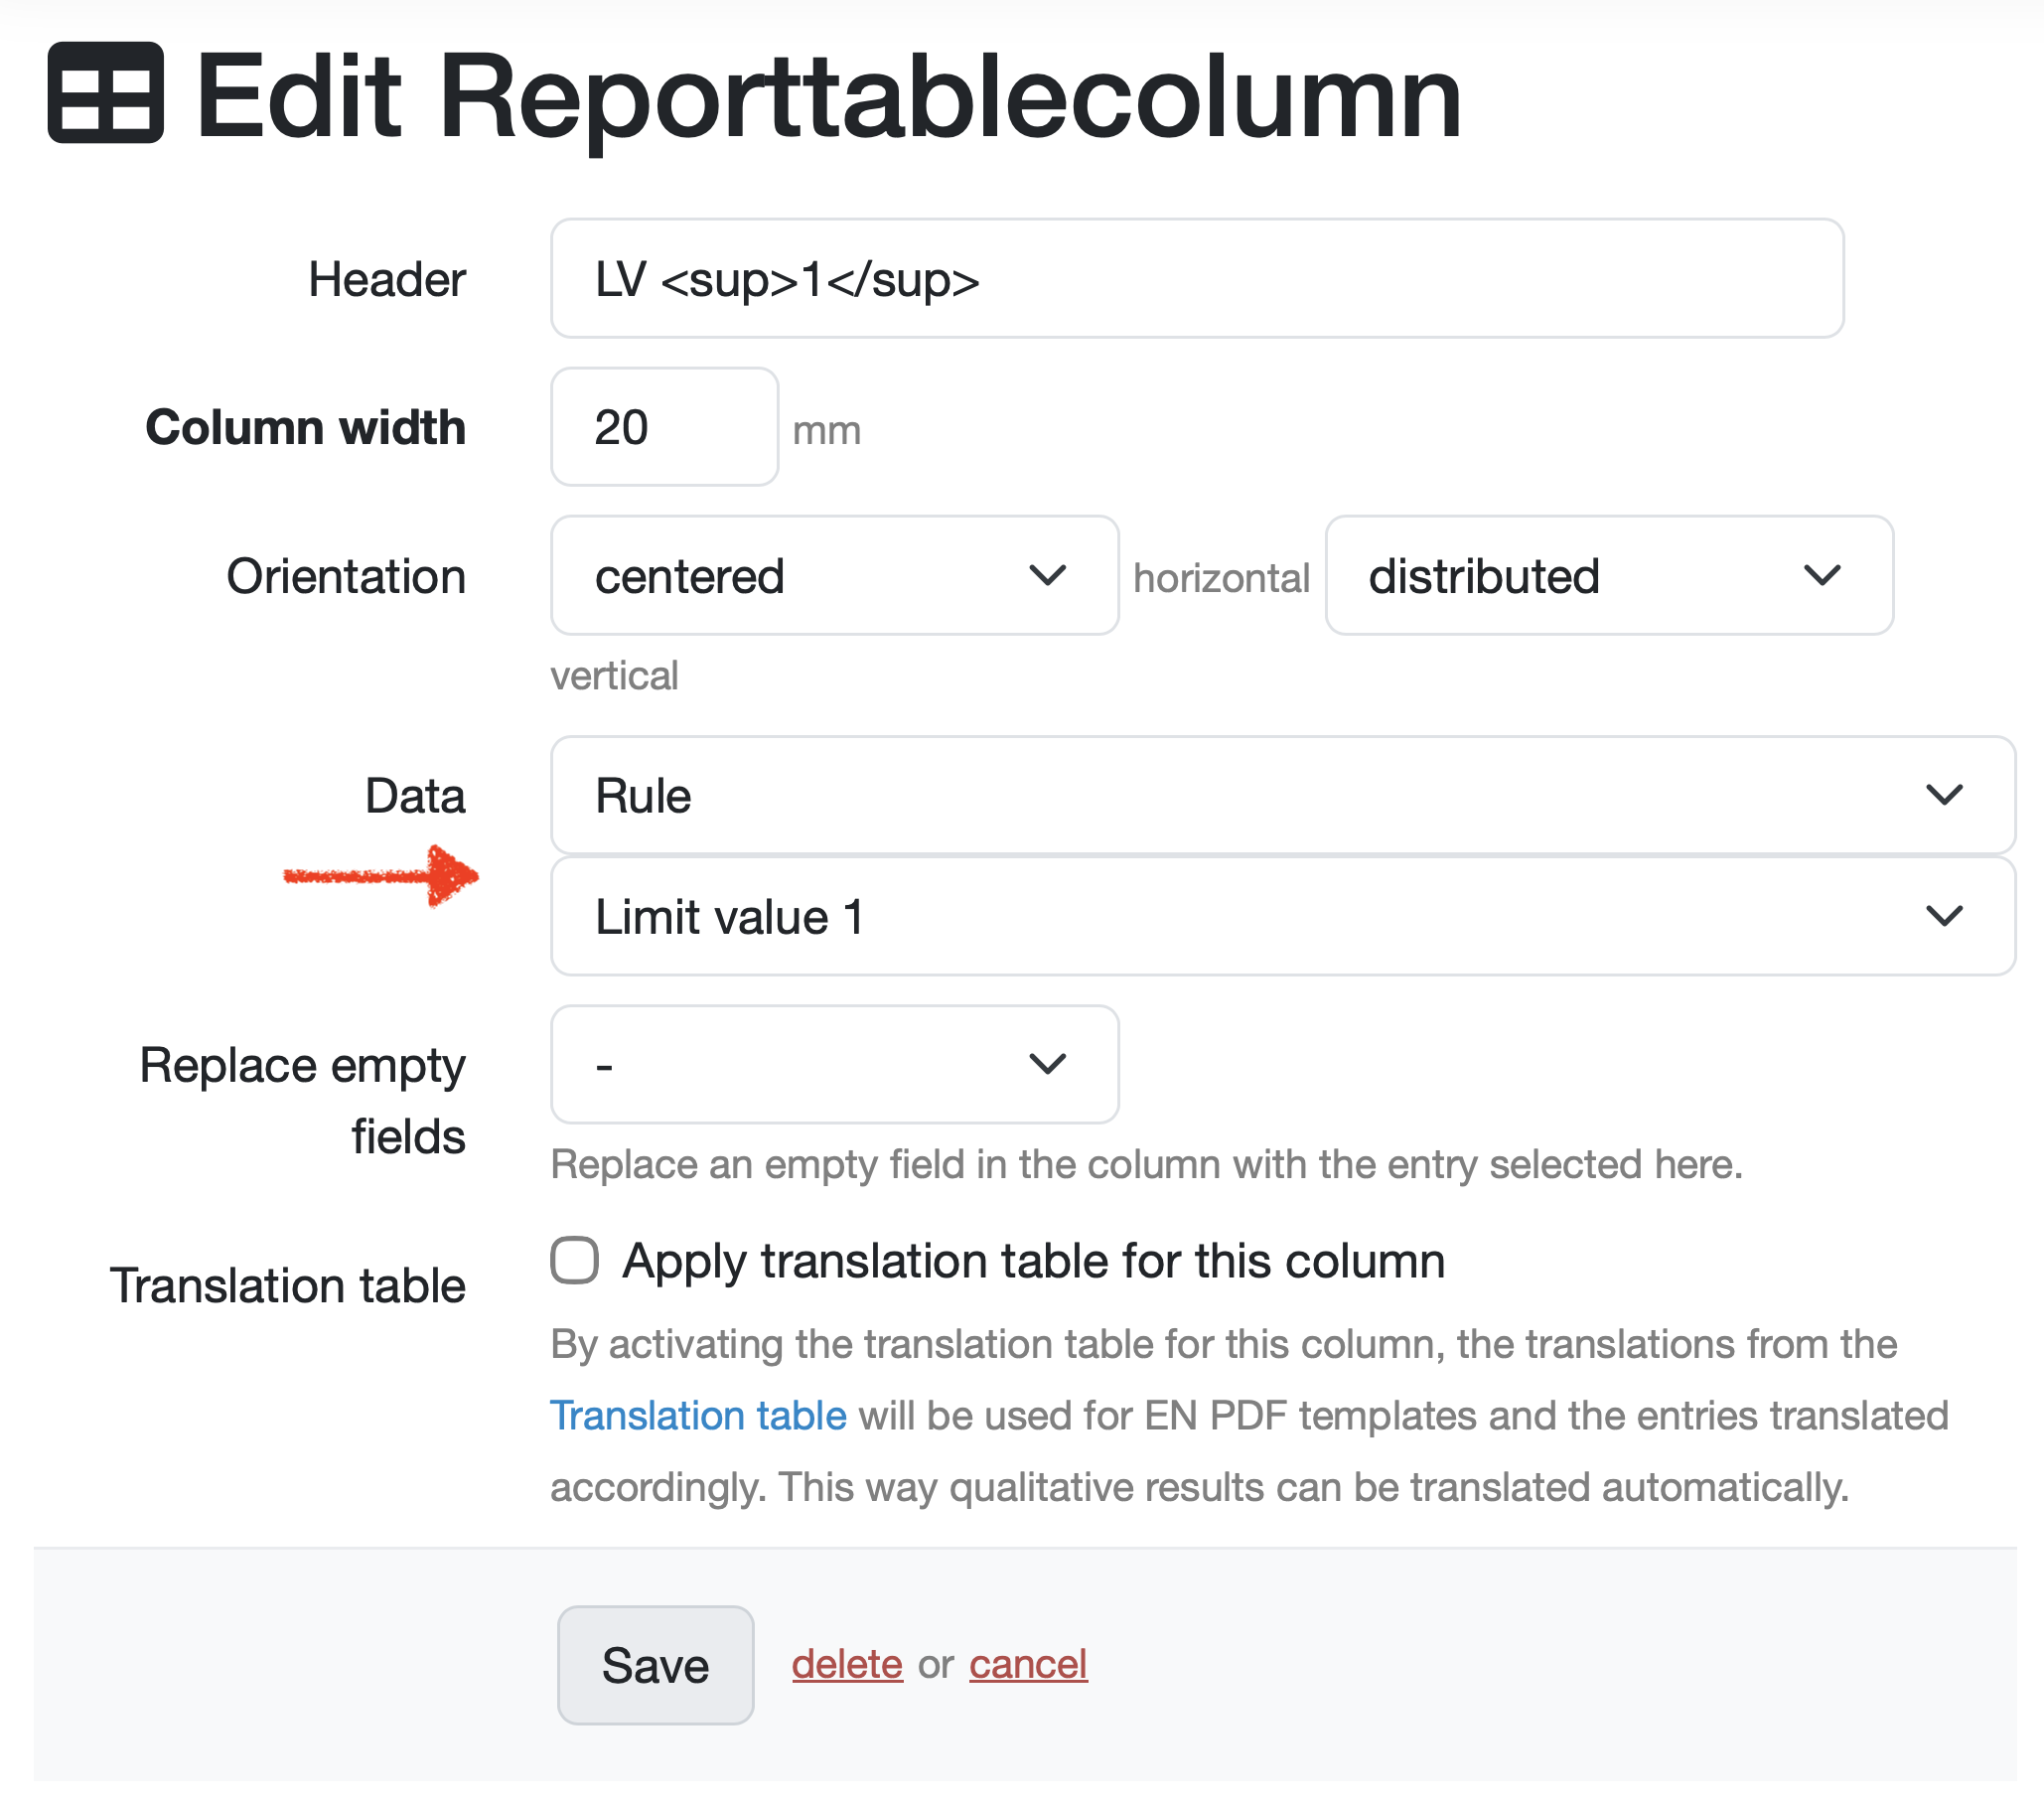
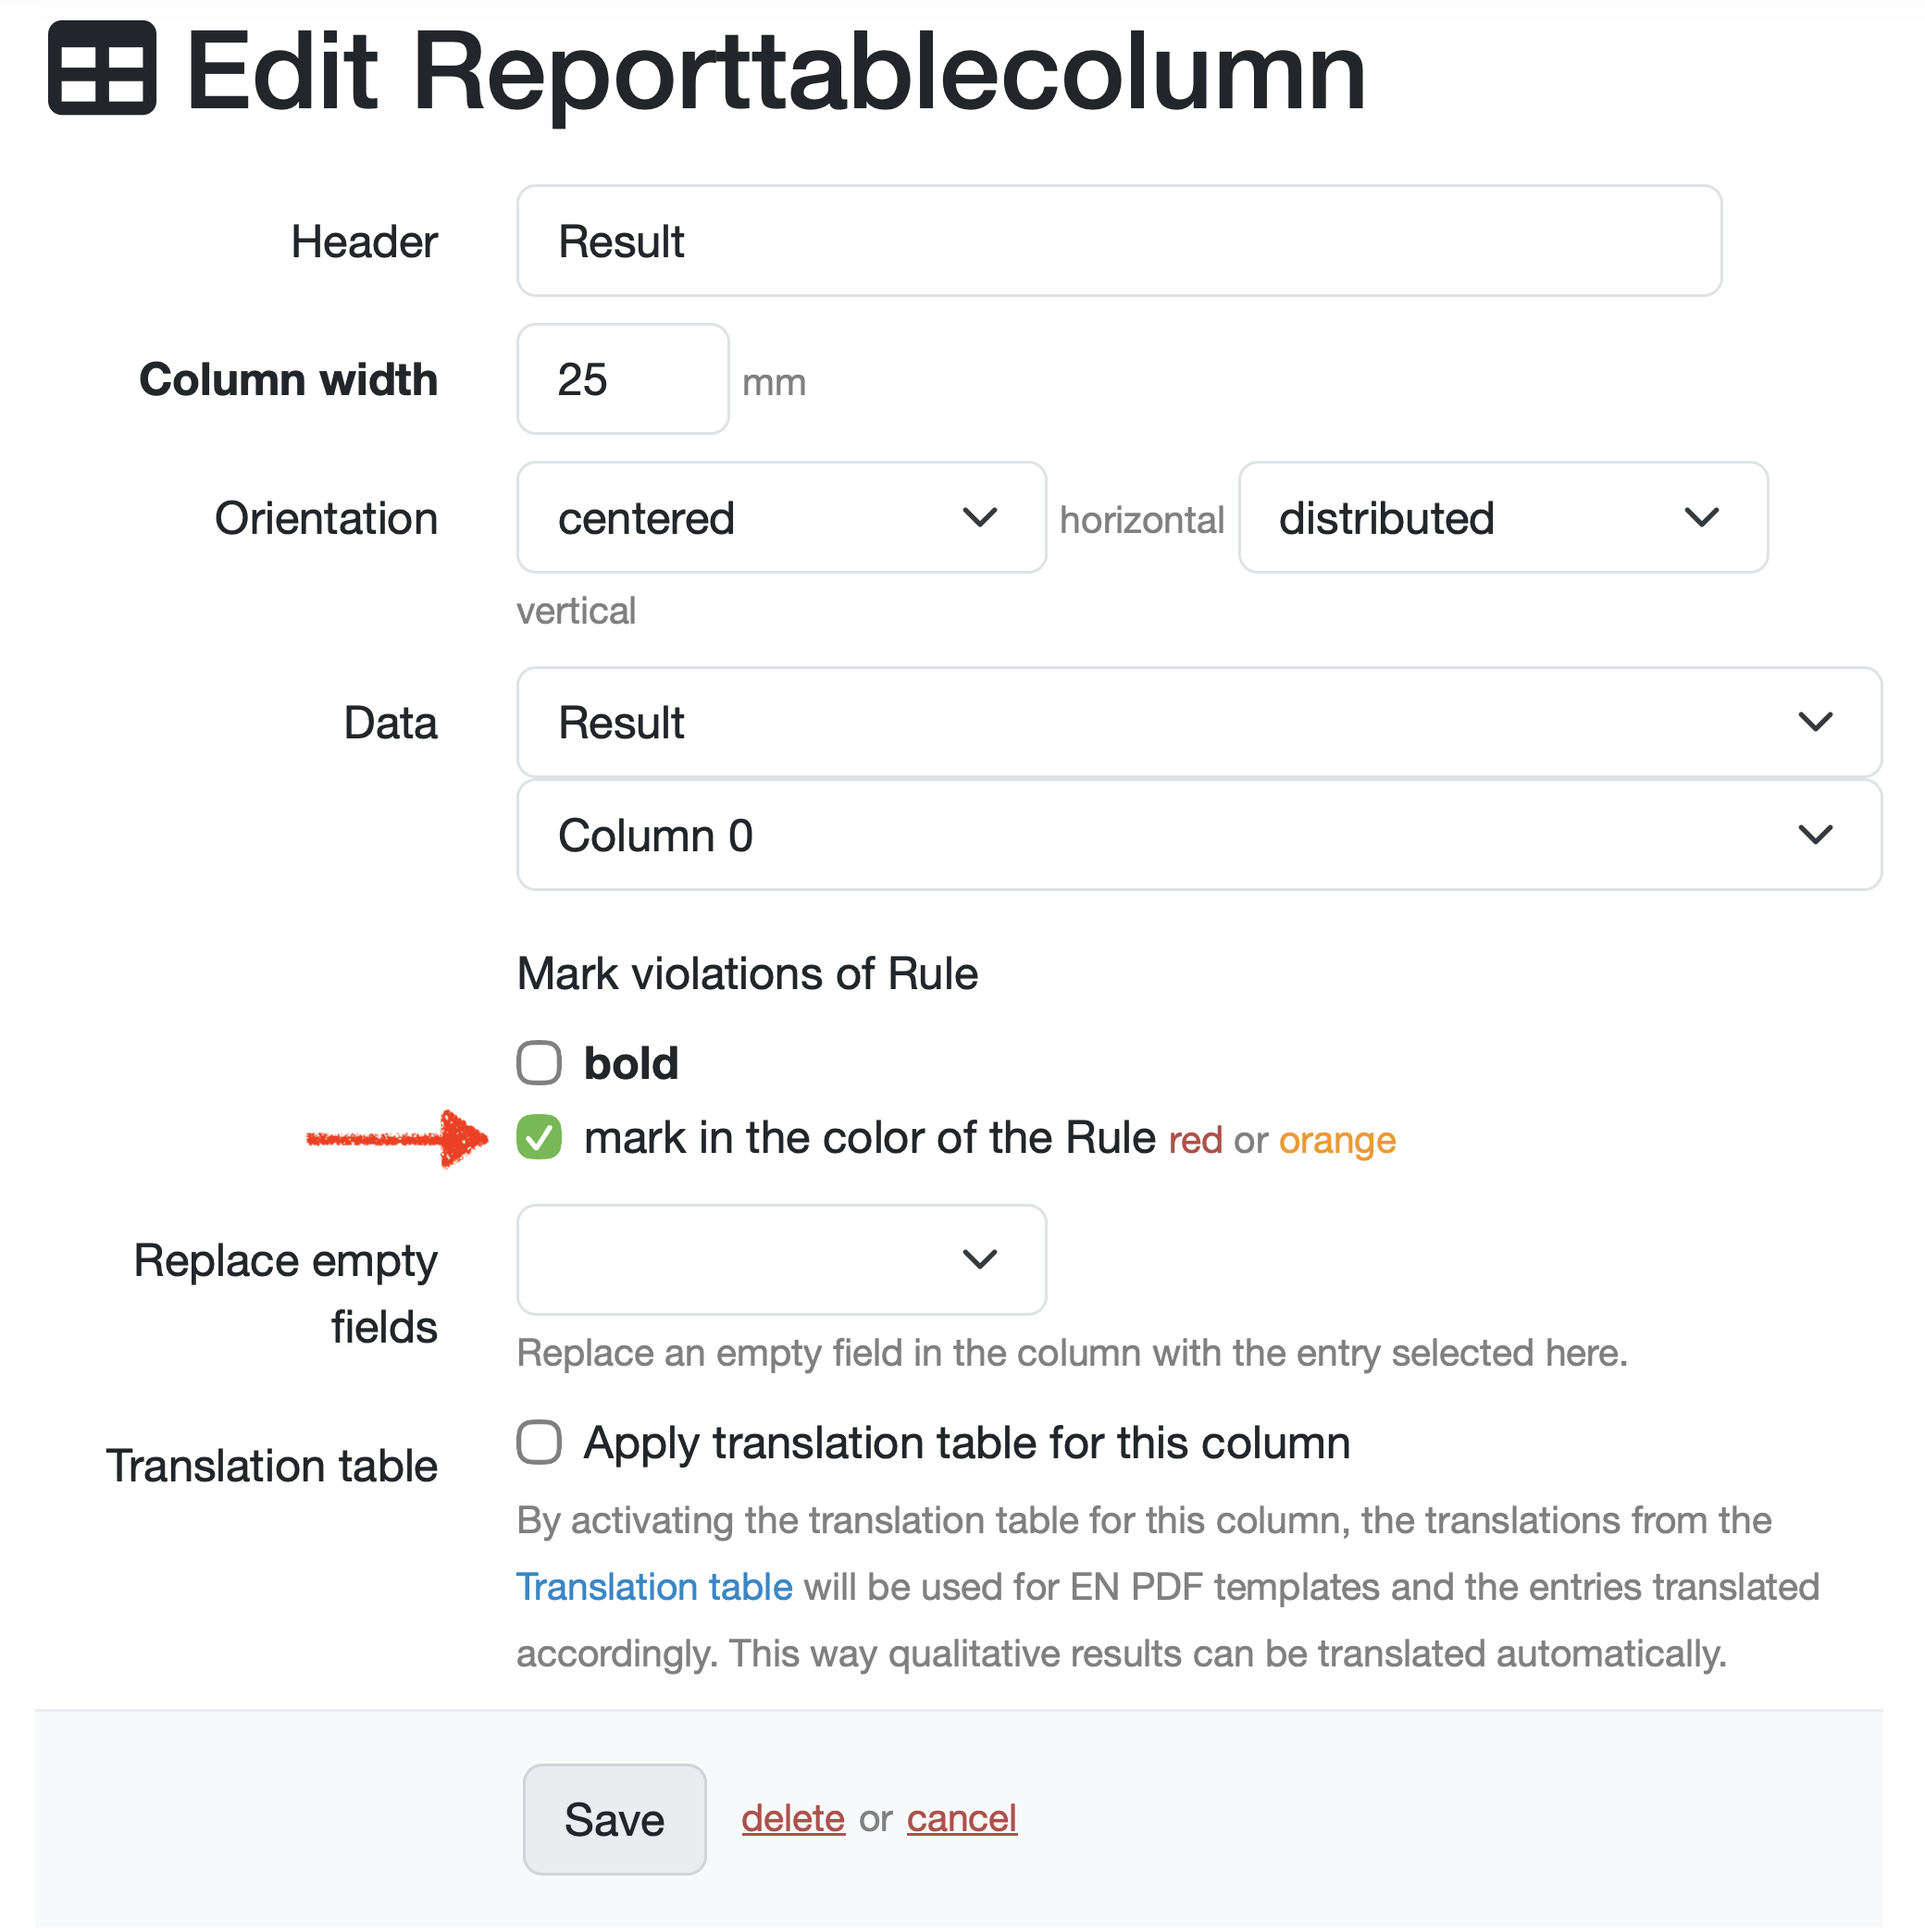
- Create the content of the table. (See instructions: Create / Edit reporttable column)
All columns show entries related with the parameters.

3.1. Select the data Rule, to reflect the configured set value (Limit value 1 in this example) of the respective parameter.
3.2. If you want to highlight target value violations in results, select either the Mark in the color of the rule red or orange or bold check box for the results column.
- Enter the text of the footer.
Last change: 07/18/26
General information
- Main menu
- Dashboard
- Backup / Data protection
- Version number of the LDB
- Supported browsers
- Activation of SSO
- Print labels
- Automatic LDB validations
- Create/Edit/Delete Categories
- Status management
- SMTP Configuration
- Konfiguration SMTP via OAuth 2.0
- IT requirements for the use of the Labordatenbank
- Add Dashboard Widgets
- Evaluation criteria for suppliers
- Edit evaluation criteria for suppliers
- Overview Deleted Records
- Email informations
- Vacation days
- Manage Weekly Hours
- Manage materials
- Onlineorder detailview
- Manage orders
- Edit orders
- Edit process key figures
- Create process key figures
- Manage 8D-Reports
- Process management view editing
- Edit processes
- Manage Projects
- Edit projects
- Edit planned order
- Edit planned samples
- Tag management
Samples
- Manage samples
- Add/Edit/Delete samples
- Enter values
- Results table
- Charts and Statistical Key Figures
- Manage Filters
- Edit - Search Filters and Column Filters
- Map pooled samples in LIMS
- Manage Stations
- Create / edit / delete station
- Book samples into a station
PDF templates
- Manage PDF Templates
- Create/edit PDF templates
- Create design elements
- Design elements Setting options
- Integrate report tables into PDF template
- Design element for the reason for reissuing test reports
- PDF template for sample labels
Employees
- Manage employees
- Add/edit/archive employee
- Manage employee groups
- Edit employee group
- Create task
- Audit Trail: traceable documentation of all work
- Access rights
- Edit Accessright
- Time tracking - Create hours entry
- Time tracking - Hours per day
- Time tracking - Hours per week
- Time tracking - Annual overview
- Labordatenbank Login / Logout
- Change password
- activate Multi-Factor-Authentification (MFA) with TOTP
- activate a Security Key for the MFA
- Activation of Passkey
- Install TOTP App
- Import employees (introduction phase)
Assets
- Manage assets
- Add/edit/archive asset
- Add subassets to asset
- Add Planned Order and Sample
- Add tests to order templates
- Copy assets, order templates, and asset components
- Equipment GPS location
- Add on-site inspection
Recipes
- Manage recipes
- Create/edit recipe
- Recipe detail view and ingredients
- Quality assurance for recipes: testing, evaluating, documenting
Reports
- Create report
- Inserting Images and File Attachments into a Report
- Sign reports
- Request signature
- Reissue of signed reports
- Send reports by e-mail or post
- Protect emails from spam filters
- Verify authenticity of reports and certificates
- Certificate
- Manage signatures
- Create / edit / delete a signature
Report table editor
- Create/edit/delete a report table
- Create / Edit reporttable column
- Creating a parameter table with target values
- Create sample table
- Create table with open structure
- Order of the report tables
- Fonts and character set for PDF reports
- Report tables overview
- Create checklist with report table editor
- Measurement repetitions value selection
Interfaces
- Import Interfaces Overview
- AI Extension for Import Interfaces
- Edit Attributes in Import Mapping
- Import results from measuring instruments
- Create CSV measurement data import interface
- Import measurement data
- Import of samples
- Mode for measured value import
- Automatic FTP/SFTP Import
- Test SFTP/FTP Connection
- Testing the HTTPS Import Interface
- Transformation code for importing other data formats
- Practical example: Import GC/MS measurement values to your LIMS system
- Practical example: Import Biomerieux Vitek antibiogram into LIMS
- Connect Thermo Fisher Chromeleon to LIMS
- Connect PCR to LIMS with plate assignment
- LIMS connection to DEMIS reporting for pathogen detection
- Tips for import interfaces
- Imort pictures in parameters
- Connection of Essentim data loggers
- SHAPTH - Drinking water database report transmission
Kompetenzen
AI functions
- Enable/disable AI integration
- AI Explorer
- Query Explorer
- AI Import: Automatically assign external calibration certificates
- Enable and Use Audit Assistant
Introductory phase
- Labordatenbank introduction checklist
- Labordatenbank data structure
- Implementing the QM-Database
- Import parameters (Introduction phase)
- Import sample master data (Introduction phase)
- Benefits of the LDB Cloud
- configurable master data fields in the LDB
- Transfer files securely to the LDB
Query reports
- Create query reports using a template
- SQL Basic Course
- SQL JOINs
- SQL Basics
- Create / Edit query reports
- Parameter columns
- Variables in query reports
- Export data from query reports
- Link Evaluations
- Query report tables (SQL table and SQL bar chart)
- Save and Display MySQL Backup Locally
- Link evaluations with import interface
Orders
- Create Order
- Add an order using a template
- Add samples with an order template
- Delete order
- Scanning and sending documents to the LDB with QR
- Typical configurations
- Create order templates
- Create orders using templates
- Defining order access rights
- Order schedule
Templates
- Manage templates for samples
- Create/Edit/Add Sample template
- Templates for orders, customers, materials, and other data types
Customers
- E-mail templates for reports and invoices
- Create customer
- Add / Edit / Delete contact persons at customers
- Merging duplicate customers
- Search customers
- Forward emails to the LDB
- Import customers ( introduction phase)
- Delete Customer
Client zone (optional)
Offers
- Create offer
- Add prices and price items
- Appendix with Terms and Conditions and Service Catalog
- Send Offer
Invoices
- Manage invoices
- Create Invoice
- Sending Invoices
- The English translation for "Teilzahlungen bei einer Rechnung erfassen
- Manage price list
- Exporting invoices
- Import billing items (Introduction phase)
- Create revenue centers for prices
- Activate X-invoice / E-invoice for Germany
- Create Collective Invoices
- Cancel invoice
- QR code for online banking on invoices
- Suggest billing items
Parameters
- Manage Parameters
- Parameter Detail View
- Add/Edit/Delete Parameter
- Create/edit/delete parameter group
- Daily Parameter List: What has to be done in the laboratory
- Parameter usage statistics
- Labeling of subcontracting and accreditation
- Parameter data types
- portray proficiency tests
- Manage examination packages
- Create/Edit examination packages
Calculating with parameters
- Deposit formulas with parameters
- Calculating with number sequences
- Calculation of dry matter and annealing loss
- Calculating with Date/Time Information
- Example: Weighing in and weighing out
- Example: Calculation of annealing loss with validity check
- Example: Determination of Chemical Oxygen Demand
- Example: Determination of TVC - aerobic mesophilic total viable count
- Bsp.: Drinkingwater-Legionella since March 2023 (German Regulation)
Webservices
- LDB Webservices
- Provide data as web services for external systems
- Send data to an external web service
- Send data to the Labordatenbank
- Example: Send eTermin to the LDB
- Example: JSON file for creating samples
Transformationscode
- General structure of a transformation code
- Transformation code for evaluations
- Export transformation code
- Webservice Response Handler
- Import transformation code
Test plans / limit values / specifications
- Create test plan / limit value table / specification
- Add specification limits / reference ranges
- Measurement value evaluation based on reference range values
- Detect and filter reference range deviations
- Parameter-specific text modules according to limit tables
Documents control
- Create a New Document
- Create new version
- Validate document
- Release Document
- Request read confirmation
- Import documents (Introduction phase)
- Change the document creator afterwards
- Delete documents
- Documents: Confirm validity check
Material
- Functions of Material Management
- Create/edit/delete material
- Linking materials with parameters
- Reorder Materials Online
- Management of chemicals
- Manage/Create/Edit/Delete Batches
- Use batch samples
Questions and answers
- IT requirements
- Where can I find the current version number of the _LABORDATENBANK__?
- How can I calculate the average from five measured values?
- Where do you enter titles like Dr/Prof/Dipl. etc.?
- How can I change the order of parameters in the packages?
- Querious: Delete archived reports
- Download files in the Edge browser instead of opening them directly
- Transfer the status of the production system to the test system
Equipment
- Test Equipment Management
- Test equipment detailed view
- Add/edit/delete Test Equipment
- Import test equipment (introduction phase)
- Create control charts
- Import control values from test equipment
- Print labels for test equipment
- Forward emails to test equipment
- Booking Test Equipment
- Test Equipment Calendar
Trainings
- TrainingSchedule: Document Training Sessions, Demonstrate Competencies
- Add/edit/delete training
- Import Trainings (Introduction phase)
8D-report
Others
Supplier evaluation
File management
- Add Files (to Samples, Customers, Orders)
- Add Files (Test Equipment, Material, Batches, Specifications)
- File Management
- Search data
Processes