Charts and Statistical Key Figures
Navigation
You can access the chart view via:
Navigation bar → Samples → Sample list → Results table → Click on parameter abbreviation
Alternatively, you can access the statistics directly from a specification.
Overview
The chart view enables:
- Display of measurement value trends across multiple samples as a line chart
- Analysis of correlations between two parameters as a correlation diagram
- Visualization of the frequency distribution of measured values as a histogram
- Display of statistical key figures (number of samples, min, max, mean, StDev.S, Sollwert Max/Min, Cp, CpK)
- Display of specification limits as colored reference lines in the chart
- Configuration of up to four parameters simultaneously
The page is divided into four areas:
- the configuration panel (left, highlighted in yellow)
- the statistics tables (top right)
- the chart area (below)
- the sample table with samples and their values (below the chart area).
These areas are described below.
Configuration Panel
In the configuration panel, you select the parameters to be displayed and an optional specification.
1st–4th Parameter
Up to four parameters can be configured per chart. Two dropdown fields are available for each parameter:
- Parameter selection (first dropdown): Select the desired parameter from the grouped list.
- Column selection (second dropdown, configuration-dependent): If multiple columns are available for the selected parameter type, the first column appears automatically. Select a different column if required.
Note: The 2nd, 3rd and 4th parameter selections are optional. If no second parameter is selected, the correlation diagram and the second histogram tab are not available.
Specification
- Optionally select a specification from the dropdown to display the associated specification limits as reference lines in the chart.
Display
- Click the anzeigen button to load the chart with the selected settings.
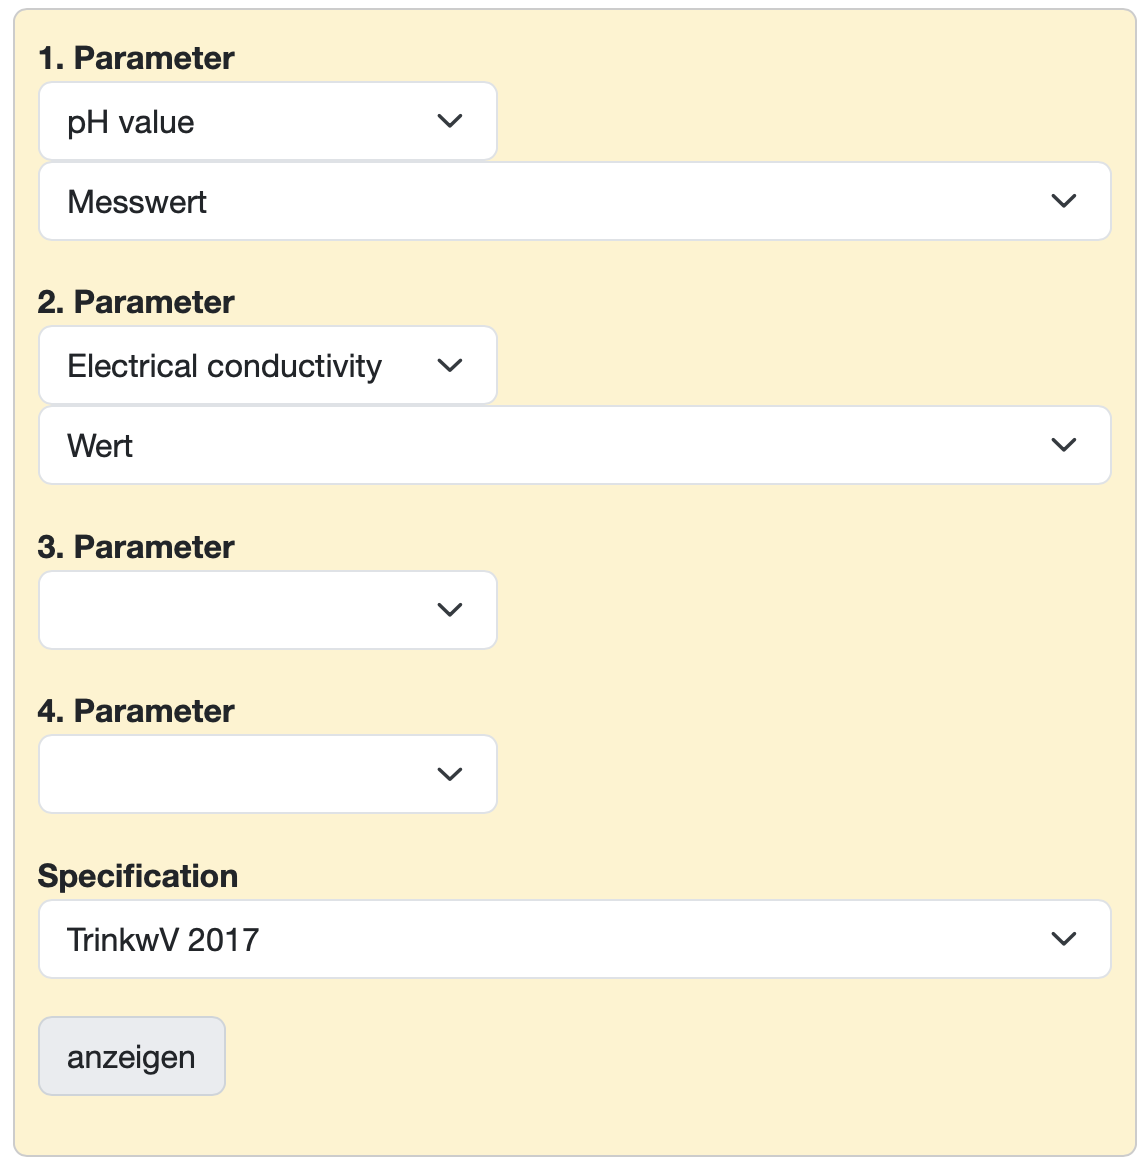
Figure: Configuration panel
Statistics Tables
For each configured parameter, the statistical key figures are displayed in a tabular overview in the top right.
| Key figure | Description |
|---|---|
| Samples | Number of evaluated samples with an existing measured value |
| min | Smallest measured value |
| max | Largest measured value |
| Mittelwert | Arithmetic mean of all measured values |
| StDev.S | Sample standard deviation |
| Sollwert Max | Upper specification limit (USL), if a specification is selected |
| Sollwert Min | Lower specification limit (LSL), if a specification is selected |
| Cp | Process capability index (only if specification limits are available) |
| CpK | Critical process capability index (only if specification limits are available) |
Chart Types
Depending on the parameter configuration, several chart types are available as tabs below the configuration panel.
Line Chart
The Chart tab displays the trend of measured values across all samples found as a line chart.
- Each configured parameter is displayed as its own line in its own color.
- With multiple parameters, separate Y-axes are displayed (left and right).
- Configured specification limits appear as colored dashed reference lines (e.g. red for tolerance limits, orange for action limits).
- The X-axis shows the sample numbers.
- The chart can be zoomed in the X and Y directions (click and drag).
- Hovering over a data point displays a tooltip with the sample number and measured value. The sample number is directly clickable and leads to the detail view of the respective sample.
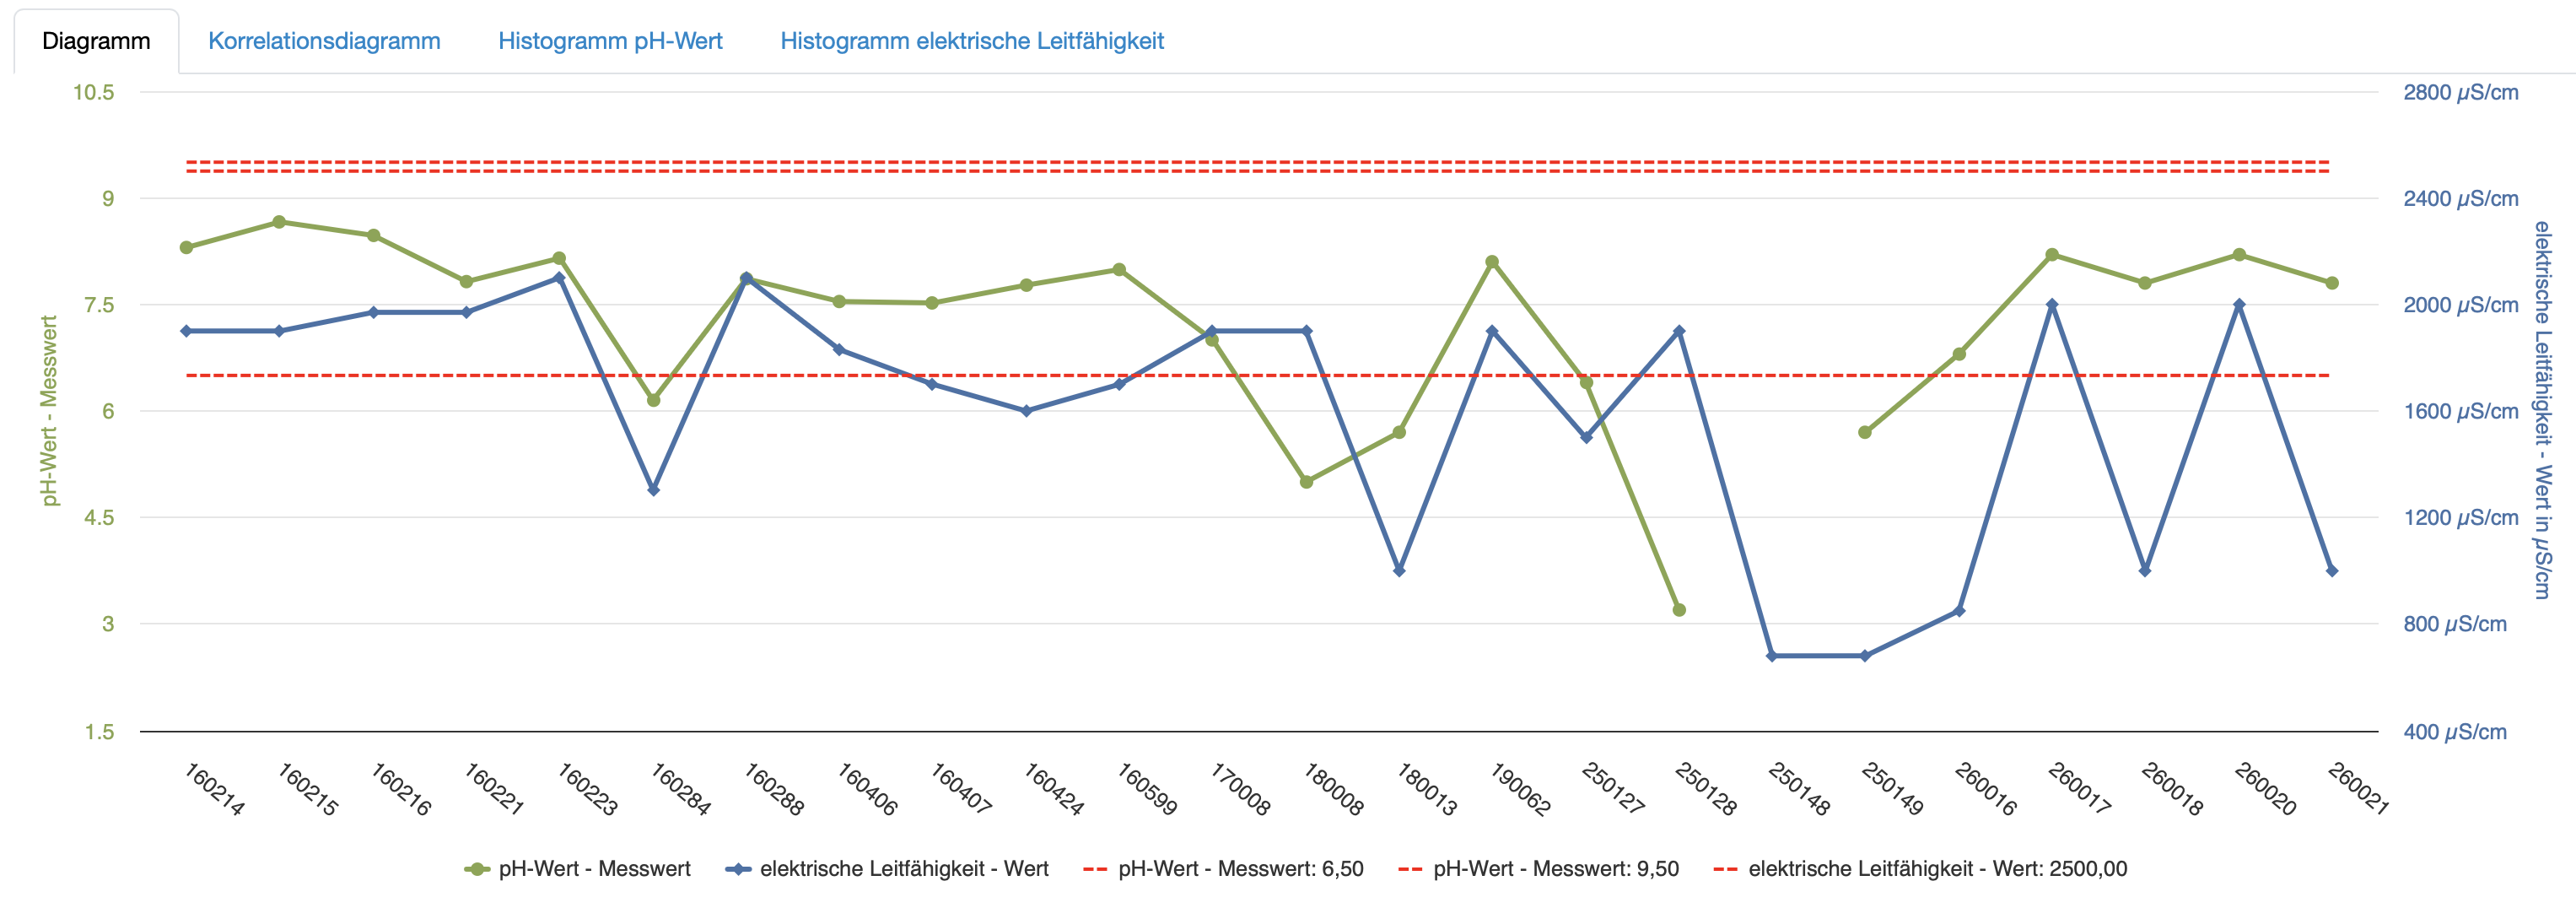
Figure: Line chart
Correlation Diagram
The Correlation Diagram tab is available as soon as at least two parameters are selected. It displays the measured values of both parameters as a correlation diagram (scatter plot) with Pearson correlation and regression line.
- The X-axis shows the values of the 2nd parameter, the Y-axis shows the values of the 1st parameter.
- The Pearson correlation of the two parameters is displayed as a key figure above the chart.
- The regression line is displayed.
- Configured specification limits are displayed as dashed lines (vertical or horizontal).
- The tooltip shows the sample number, X-value and Y-value when hovering over a point. The sample number is clickable.
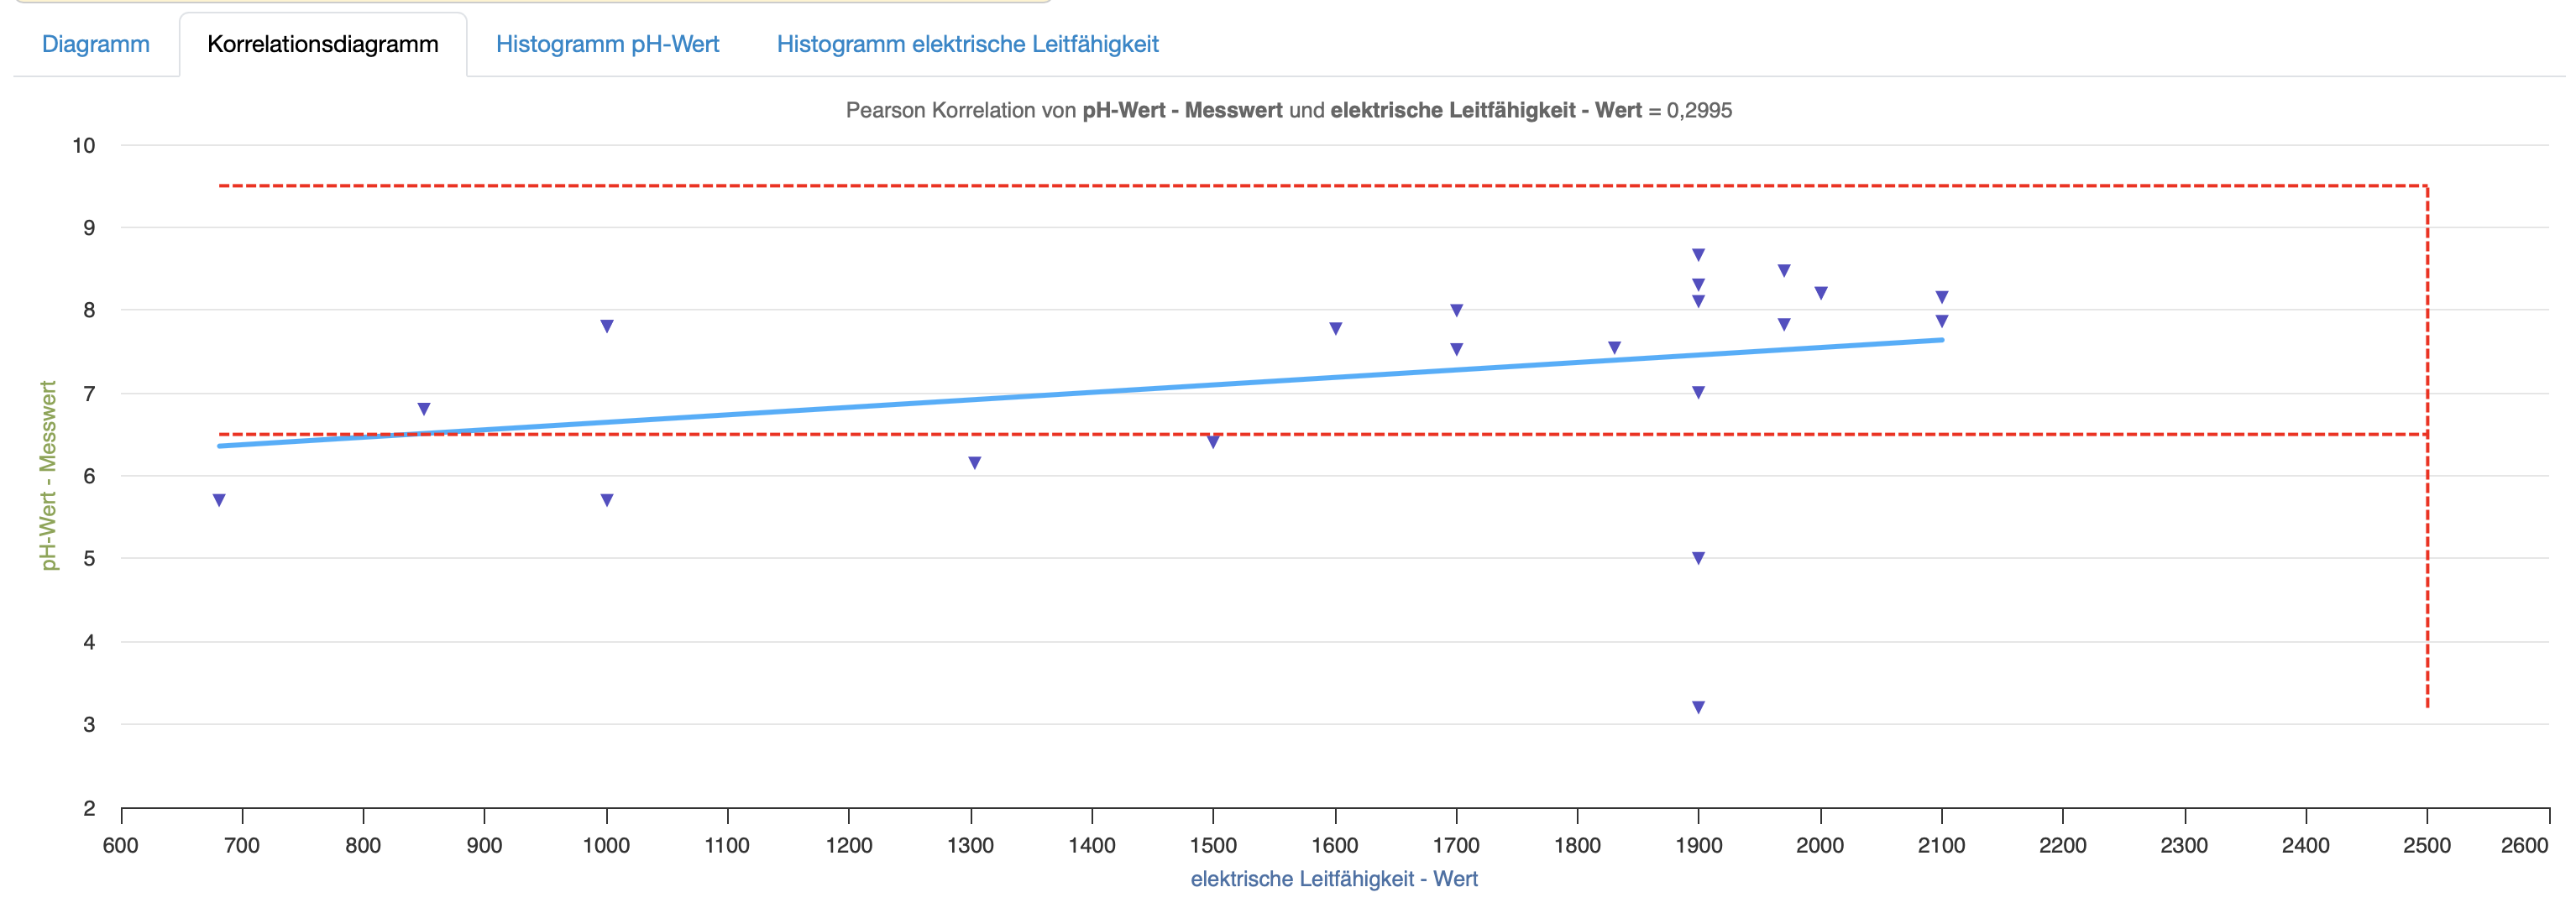
Figure: Correlation diagram
Histogram
A separate histogram tab is available for each selected parameter.
- The histogram shows the frequency distribution of the measured values as a bar chart.
- A dashed normal distribution curve (Gaussian curve) is displayed automatically.
- The Y-axis shows the absolute frequency, the X-axis shows the measured value.
- Configured specification limits are displayed as vertical dashed lines.
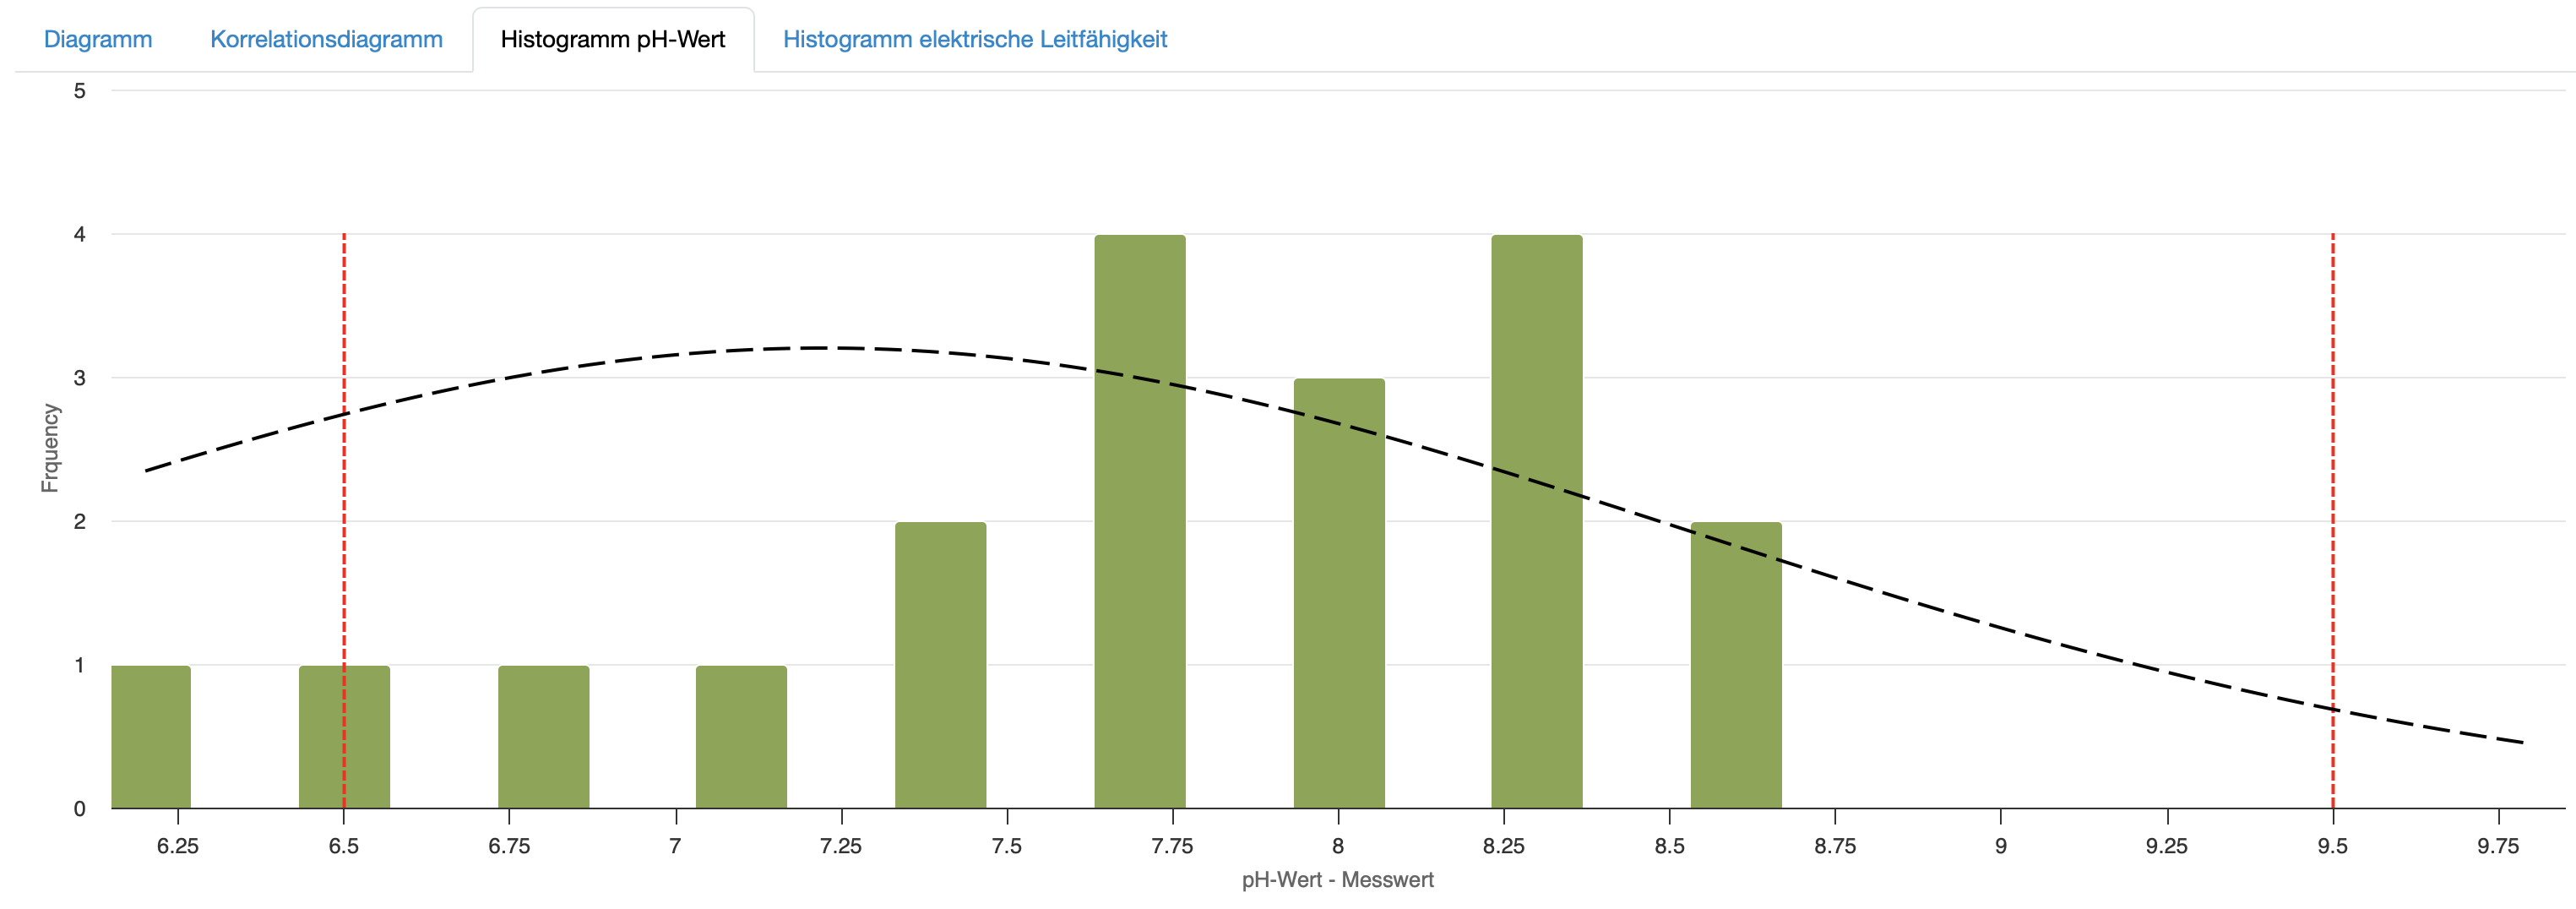
Figure: Histogram
Sample Table
A tabular overview of all samples found is displayed below the chart area.
| Column | Description |
|---|---|
| Sample | Sample number as a clickable link to the sample detail view |
| Date | Entry date of the sample |
| Parameter name, unit | Measured value of the respective parameter for this sample; one column per configured parameter |
Compiling Individual Statistics
You can compile statistics from the entire database in three steps.
Step 1: Filter samples
- Filter the desired samples using e.g. the advanced search in the sample management.
Step 2: Open results table
- Select all desired samples using the checkbox below the sample list.
- Select Ergebnistabelle and anzeigen.
Step 3: Open statistics
- Click on the blue highlighted parameter abbreviation in the column header of the results table to display the statistics for that parameter.
Last change: 07/28/26
General information
- Main menu
- Dashboard
- Backup / Data protection
- Version number of the LDB
- Supported browsers
- Activation of SSO
- Print labels
- Automatic LDB validations
- Create/Edit/Delete Categories
- Status management
- SMTP Configuration
- Konfiguration SMTP via OAuth 2.0
- IT requirements for the use of the Labordatenbank
- Add Dashboard Widgets
- Evaluation criteria for suppliers
- Edit evaluation criteria for suppliers
- Deleted Records
- Email informations
- Vacation days
- Manage Weekly Hours
- Manage materials
- Onlineorder detailview
- Edit process key figures
- Create process key figures
- Manage 8D-Reports
- Process management view editing
- Edit processes
- Manage Projects
- Edit projects
- Edit planned order
- Edit planned samples
- Tag management
Orders
- Manage orders
- Order Detail View
- Create/edit/delete Order
- Scanning and sending documents to the LDB with QR
- Order schedule
Samples
- Manage samples
- Add/Edit/Delete samples
- Enter values
- Results table
- Charts and Statistical Key Figures
- Manage Filters
- Edit - Search Filters and Column Filters
- Map pooled samples in LIMS
- Manage Stations
- Create / edit / delete station
- Book samples into a station
PDF templates
- Manage PDF Templates
- Create/edit PDF templates
- Create design elements
- Design elements Setting options
- Integrate report tables into PDF template
- Design element for the reason for reissuing test reports
- PDF template for sample labels
Employees
- Manage employees
- Add/edit/archive employee
- Manage employee groups
- Edit employee group
- Create task
- Audit Trail: traceable documentation of all work
- Access rights
- Edit Accessright
- Time tracking - Create hours entry
- Time tracking - Hours per day
- Time tracking - Hours per week
- Time tracking - Annual overview
- Labordatenbank Login / Logout
- Change password
- activate Multi-Factor-Authentification (MFA) with TOTP
- activate a Security Key for the MFA
- Activation of Passkey
- Install TOTP App
- Import employees (introduction phase)
Assets
- Manage assets
- Add/edit/archive asset
- Add subassets to asset
- Add Planned Order and Sample
- Add tests to order templates
- Copy assets, order templates, and asset components
- Equipment GPS location
- Add on-site inspection
Recipes
- Manage recipes
- Create/edit recipe
- Recipe detail view and ingredients
- Quality assurance for recipes: testing, evaluating, documenting
Reports
- Create report
- Inserting Images and File Attachments into a Report
- Sign reports
- Request signature
- Reissue of signed reports
- Send reports by e-mail or post
- Protect emails from spam filters
- Verify authenticity of reports and certificates
- Certificate
- Manage signatures
- Create / edit / delete a signature
Report table editor
- Create/edit/delete a report table
- Create / Edit reporttable column
- Creating a parameter table with target values
- Create sample table
- Create table with open structure
- Order of the report tables
- Fonts and character set for PDF reports
- Create checklist with report table editor
- Measurement repetitions value selection
Interfaces
- Import Interfaces Overview
- AI Extension for Import Interfaces
- Edit Attributes in Import Mapping
- Import results from measuring instruments
- Create CSV measurement data import interface
- Import measurement data
- Import of samples
- Mode for measured value import
- Automatic FTP/SFTP Import
- Test SFTP/FTP Connection
- Testing the HTTPS Import Interface
- Transformation code for importing other data formats
- Practical example: Import GC/MS measurement values to your LIMS system
- Practical example: Import Biomerieux Vitek antibiogram into LIMS
- Connect Thermo Fisher Chromeleon to LIMS
- Connect PCR to LIMS with plate assignment
- LIMS connection to DEMIS reporting for pathogen detection
- Tips for import interfaces
- Imort pictures in parameters
- Connection of Essentim data loggers
- SHAPTH - Drinking water database report transmission
Kompetenzen
AI functions
- Enable/disable AI integration
- AI Explorer
- Query Explorer
- AI Import: Automatically assign external calibration certificates
- Enable and Use Audit Assistant
Introductory phase
- Labordatenbank introduction checklist
- Labordatenbank data structure
- Implementing the QM-Database
- Import parameters (Introduction phase)
- Import sample master data (Introduction phase)
- Benefits of the LDB Cloud
- Configurable attribute fields in the LDB
- Transfer files securely to the LDB
Query reports
- Create query reports using a template
- SQL Basic Course
- SQL JOINs
- SQL Basics
- Create / Edit query reports
- Parameter columns
- Variables in query reports
- Export data from query reports
- Link Evaluations
- Query report tables (SQL table and SQL bar chart)
- Save and Display MySQL Backup Locally
- Link evaluations with import interface
Templates
- Create order templates
- Manage templates for samples
- Create/Edit/Add Sample template
- Templates for orders, customers, materials, and other data types
Customers
- Manage customers
- Customer Detail View
- Create/edit/delete customer
- Merging duplicate customers
- Add / Edit / Delete contact persons at customers
- E-mail templates for reports and invoices
- Forward emails to the LDB
- Import customers ( introduction phase)
Client zone (optional)
Offers
- Create offer
- Add prices and price items
- Appendix with Terms and Conditions and Service Catalog
- Send Offer
Invoices
- Manage invoices
- Create Invoice
- Sending Invoices
- The English translation for "Teilzahlungen bei einer Rechnung erfassen
- Manage price list
- Exporting invoices
- Import billing items (Introduction phase)
- Create revenue centers for prices
- Activate X-invoice / E-invoice for Germany
- Create Collective Invoices
- Cancel invoice
- QR code for online banking on invoices
- Suggest billing items
Parameters
- Manage Parameters
- Parameter Detail View
- Add/Edit/Delete Parameter
- Create/edit/delete parameter group
- Daily Parameter List: What has to be done in the laboratory
- Parameter usage statistics
- Labeling of subcontracting and accreditation
- Parameter data types
- portray proficiency tests
- Manage examination packages
- Create/Edit examination packages
Calculating with parameters
- Deposit formulas with parameters
- Calculating with number sequences
- Calculation of dry matter and annealing loss
- Calculating with Date/Time Information
- Example: Weighing in and weighing out
- Example: Calculation of annealing loss with validity check
- Example: Determination of Chemical Oxygen Demand
- Example: Determination of TVC - aerobic mesophilic total viable count
- Bsp.: Drinkingwater-Legionella since March 2023 (German Regulation)
Webservices
- LDB Webservices
- Provide data as web services for external systems
- Send data to an external web service
- Send data to the Labordatenbank
- Example: Send eTermin to the LDB
- Example: JSON file for creating samples
Transformationscode
- General structure of a transformation code
- Transformation code for evaluations
- Export transformation code
- Webservice Response Handler
- Import transformation code
Test plans / limit values / specifications
- Create test plan / limit value table / specification
- Add specification limits / reference ranges
- Measurement value evaluation based on reference range values
- Detect and filter reference range deviations
- Parameter-specific text modules according to limit tables
Documents control
- Create a New Document
- Create new version
- Validate document
- Release Document
- Request read confirmation
- Import documents (Introduction phase)
- Change the document creator afterwards
- Delete documents
- Documents: Confirm validity check
Material
- Functions of Material Management
- Create/edit/delete material
- Linking materials with parameters
- Reorder Materials Online
- Management of chemicals
- Manage/Create/Edit/Delete Batches
- Use batch samples
Questions and answers
- IT requirements
- Where can I find the current version number of the _LABORDATENBANK__?
- How can I calculate the average from five measured values?
- How can I change the order of parameters in the packages?
- Querious: Delete archived reports
- Download files in the Edge browser instead of opening them directly
- Transfer the status of the production system to the test system
Equipment
- Test Equipment Management
- Test equipment detailed view
- Add/edit/delete Test Equipment
- Import test equipment (introduction phase)
- Create control charts
- Import control values from test equipment
- Print labels for test equipment
- Forward emails to test equipment
- Booking Test Equipment
- Test Equipment Calendar
Trainings
- TrainingSchedule: Document Training Sessions, Demonstrate Competencies
- Add/edit/delete training
- Import Trainings (Introduction phase)
8D-report
Others
Supplier evaluation
File management
- Add Files (to Samples, Customers, Orders)
- Add Files (Test Equipment, Material, Batches, Specifications)
- File Management
- Search data
Processes