Results table
Navigation
To display a sample selection in the Results table, follow this path:
Navigation bar → Samples → Manage samples → Results table → show
- In the sample list, activate the checkboxes for the relevant samples.
- Then select the Results table option from the dropdown at the bottom of the table.
- Click show.
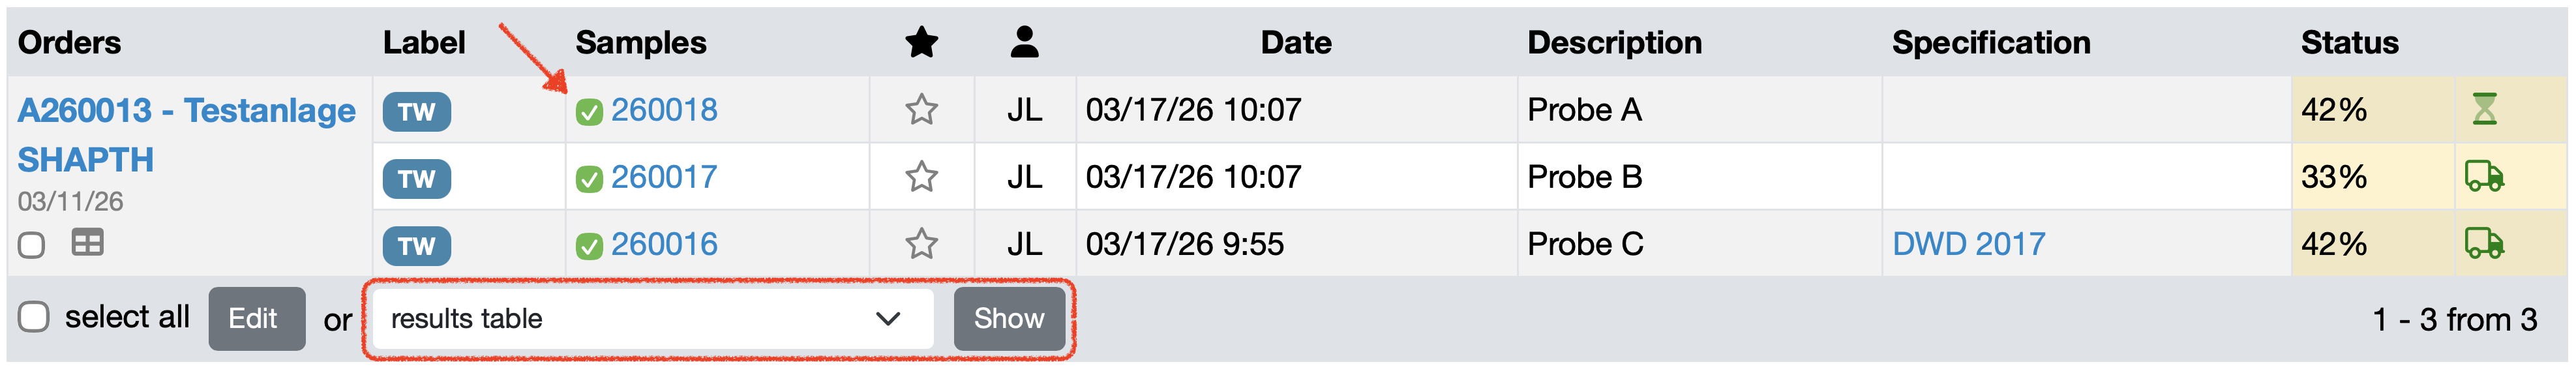
Figure: Show Results table 1
Additional ways to access the Results table:
- Click the Results table icon of the desired order to display the samples of that order in the Results table.
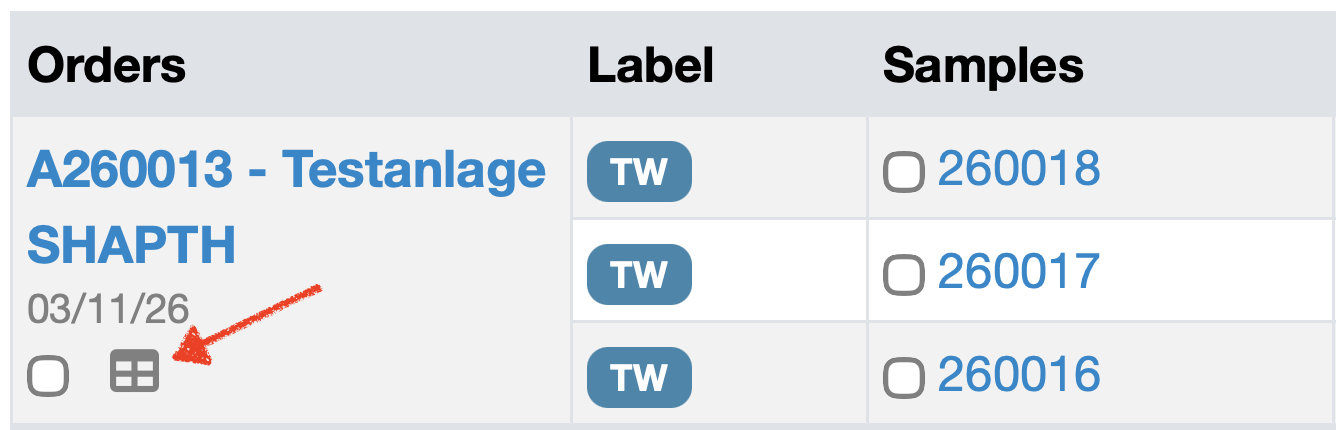
Figure: Show Results table 2
Overview
The Results table enables:
- Simultaneous display of multiple pre-selected samples with their parameters and measured values in a tabular overview.
- Direct entry and editing of measured values within this table.
- Export of data as an Excel or CSV file.
- Individual customization of the displayed parameter columns via column filters.
- Display of statistical key figures (Min, Max, Average, Standard deviation, Sum).
- Bulk editing of samples directly from the Results table.
The following figure shows what the Results table looks like in the LDB. The functions are described below.
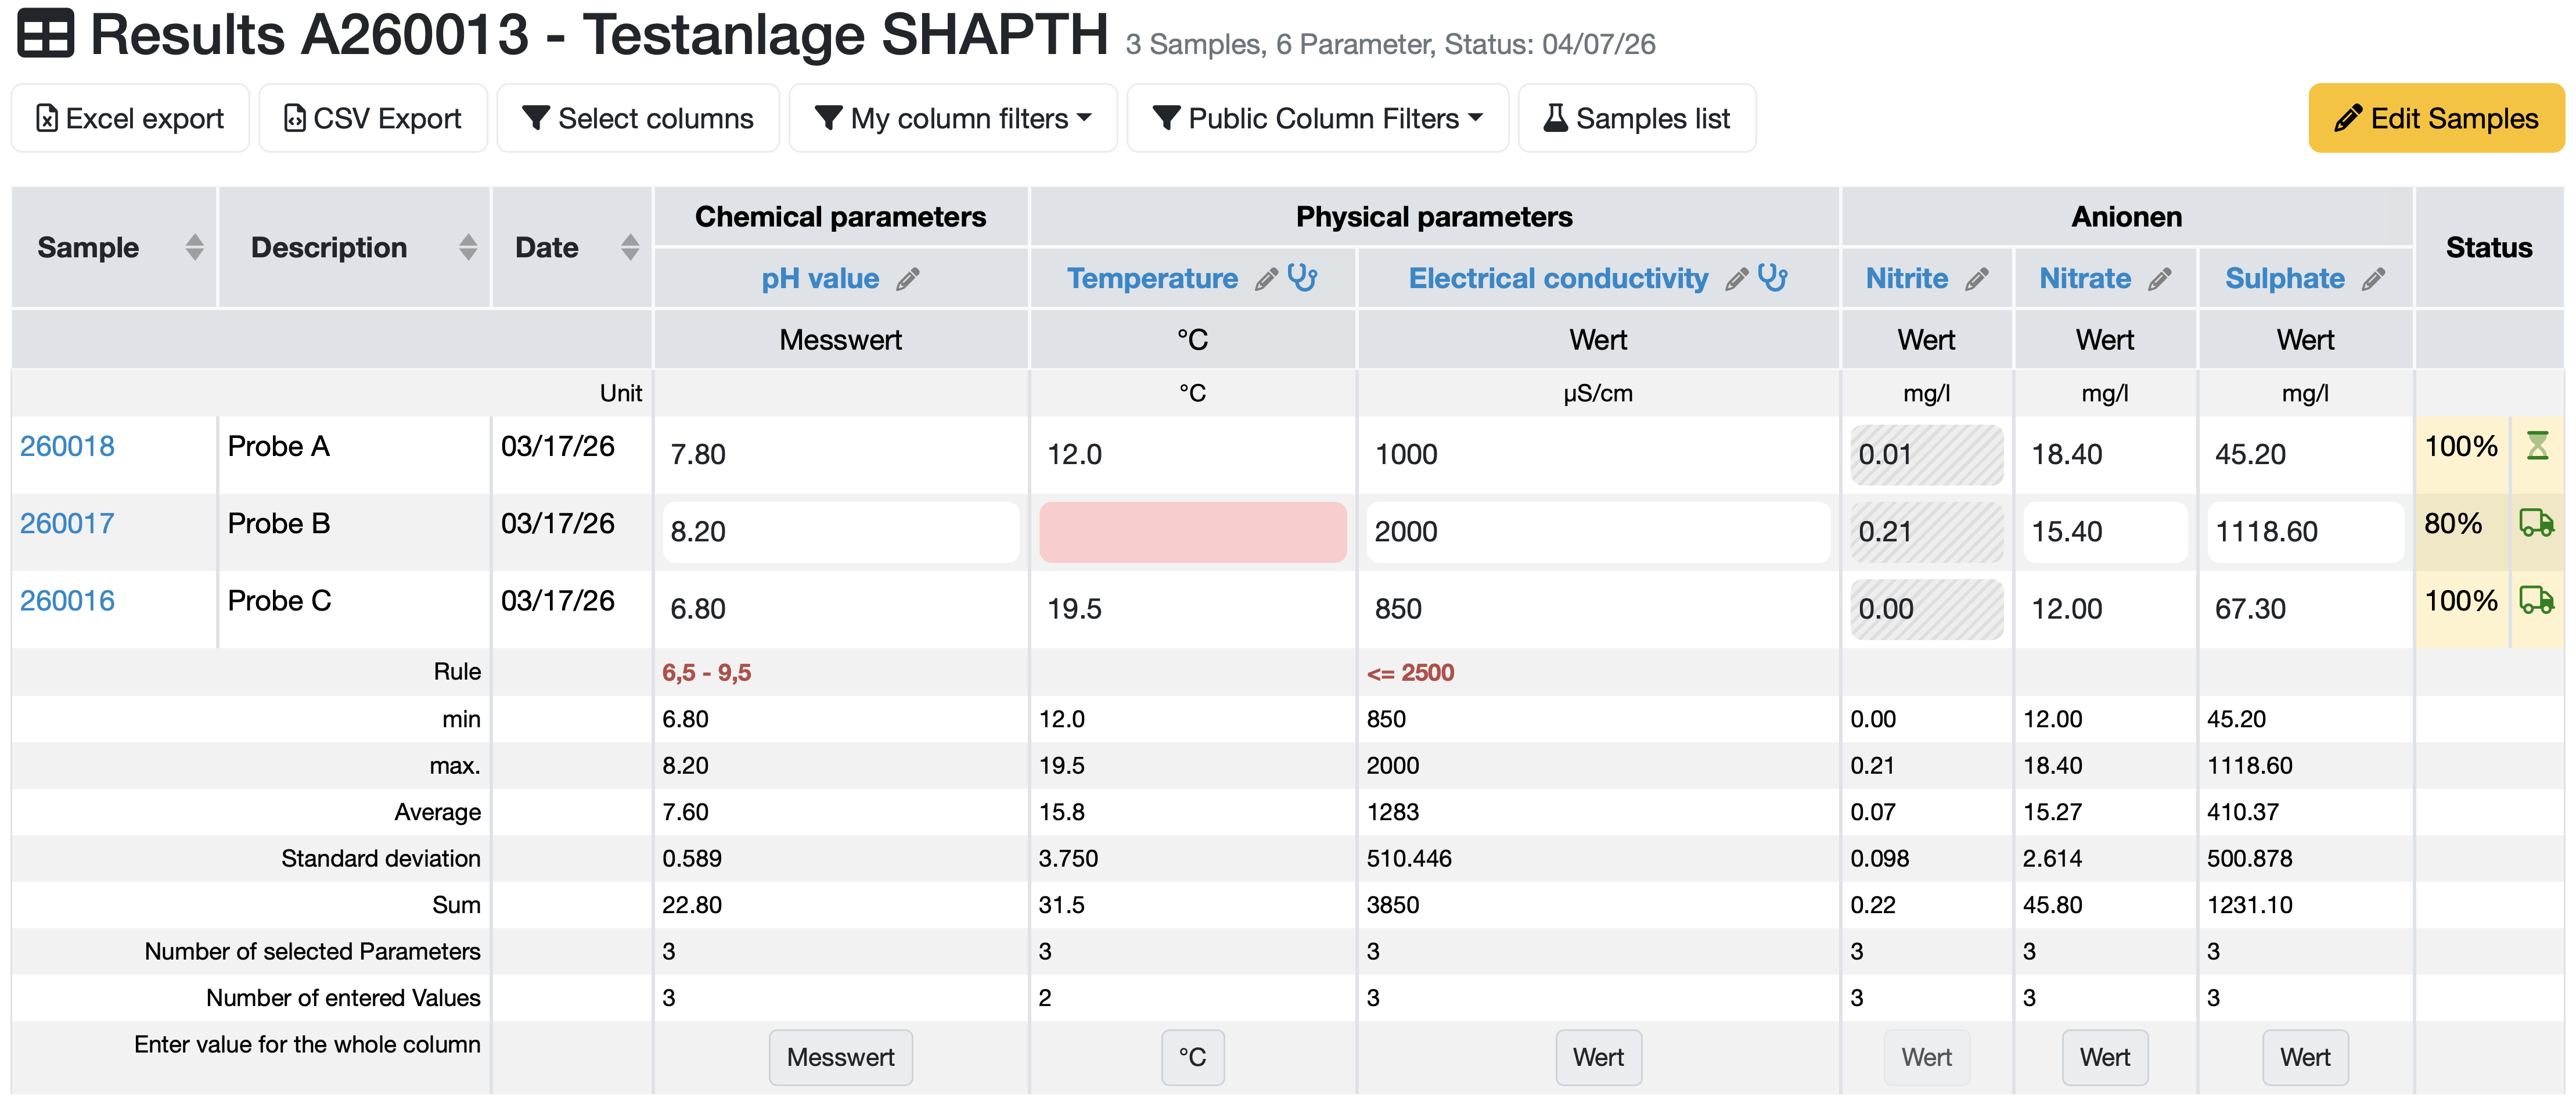
Figure: Results table
Description of the Tabular Overview
Samples are displayed row by row in a table. The parameter columns are grouped together in a configuration-dependent manner (e.g. Chemical parameters, Physical parameters, Anions).
| Column | Description |
|---|---|
| Sample | Displays the sample number as a blue-highlighted link. Clicking it opens the detail view of the sample. The column is sortable. |
| Description | Displays the sample description. The column is sortable. |
| Date | Displays the receipt date of the sample. The column is sortable. |
| Parameter groups (e.g. Chemical parameters, Physical parameters, Anions) | Sample- and configuration-dependent column groups with the respective individual parameters, units and measured values. A pencil icon next to the parameter name allows direct editing of the parameter type (with appropriate permissions). |
| Status | Displays the processing progress of the sample as a percentage along with a color-coded status symbol. |
Note: All sample numbers highlighted in blue are clickable links to the respective sample detail view. The parameter names in the header row are also clickable and open the associated chart. The naming of columns and the available parameter groups depend on the configuration.
Statistical Key Figures
Below the sample data, the Results table automatically displays statistical key figures for each parameter:
- Min – smallest entered or calculated value
- Max. – largest entered or calculated value
- Average – mean of all values
- Standard deviation – statistical spread of the values
- Sum – sum of all values
- Number of selected Parameters – number of samples for which this parameter is intended
- Number of entered Values – number of values actually entered
Functions
Entering a Value for a Parameter
Measured values can be entered directly in the Results table.
- Click on the desired parameter field in the row of the corresponding sample.
- Enter the measured value. For parameters with a dropdown selection, the corresponding options are available to choose from.
- Confirm the entry by clicking outside the field or pressing
Tabto automatically move to the next input field. - Use the keyboard shortcuts
Alt ↑, Alt ↓, Alt ←, Alt →orTabfor quick navigation between input fields.
Note: Fields highlighted in red do not yet contain a entered value. Fields highlighted in grey contain a formula for calculating results. Locked fields (highlighted in grey with diagonal stripes, or e.g. in the case of finalized samples) cannot be edited. Parameters whose field contains a dash are not selected for the respective sample.
Enter Value for the Whole Column
To enter the same value for all samples of a parameter simultaneously, the Enter value for the whole column row is available at the bottom of the Results table.
- Click the button below the desired parameter (e.g. Messwert, °C, Wert).
- Enter the desired value in the dialog that appears.
- Click save to apply the value.
The value is only saved for those samples where the parameter is selected and no value has been entered yet.
Overwriting existing values
If already entered values are to be replaced, additional confirmation is required:
- Activate the checkbox Overwrite already entered values? before clicking save.
- Without activating this checkbox, already entered values remain unchanged.
Deleting values
To delete already entered values, proceed as follows:
- Activate the checkbox Overwrite already entered values?.
- Leave the input field empty.
- Click save to remove all entered values for the parameter.
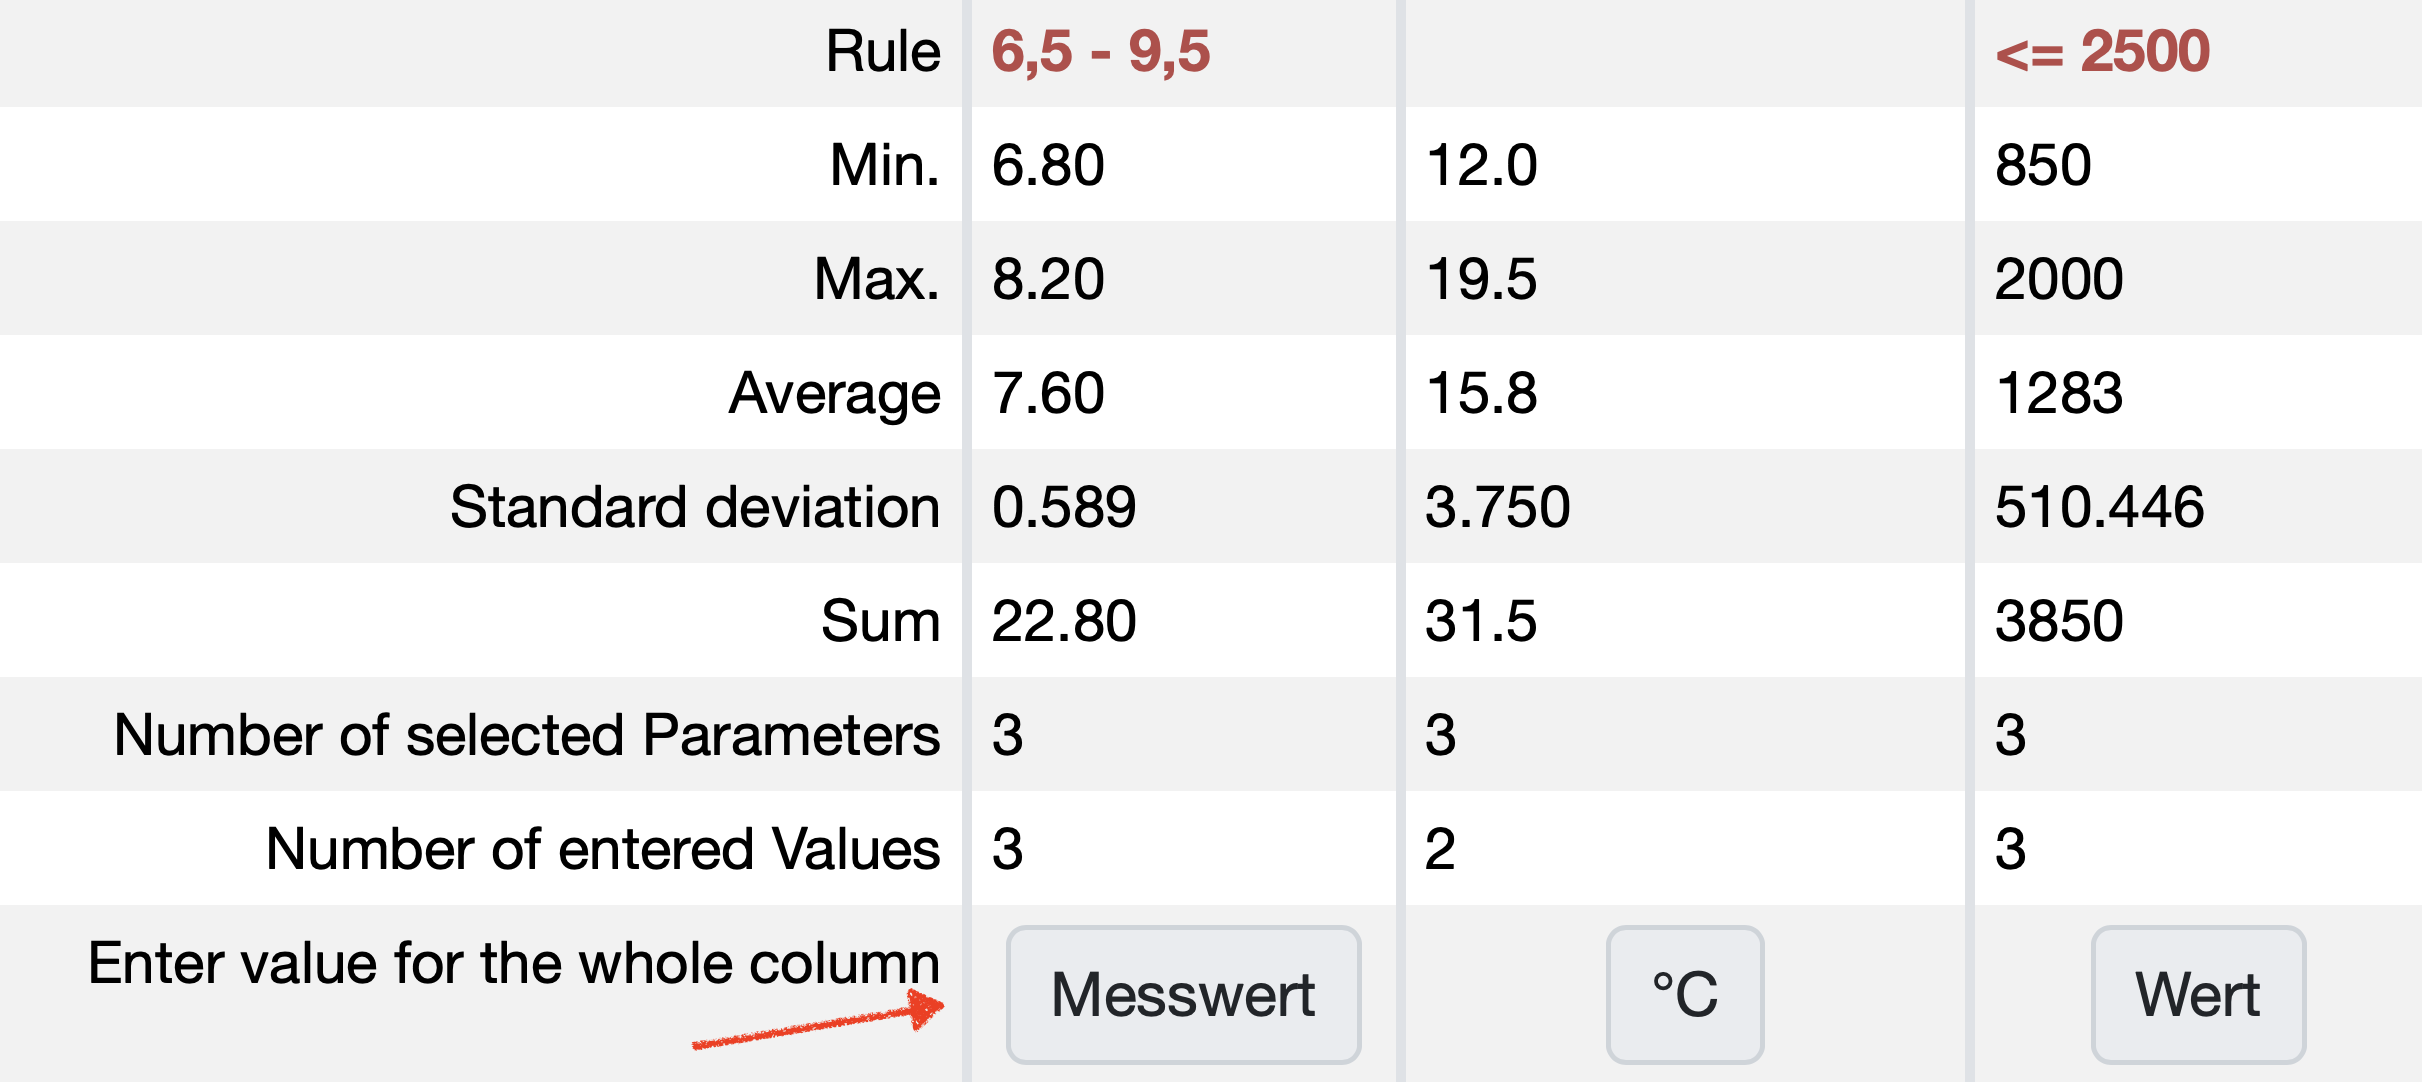
Figure: Enter value for the whole column
Select Columns
Customize the displayed parameter columns individually.
- Click the Select columns button to show the column selection.
- Activate the checkboxes of the desired parameter columns in the displayed selection row.
- Click Show column selection to reduce the view to the selected columns.
Add Column Filter
Optionally save the selection as a filter.
- Activate the Save column selection checkbox, assign a name and click save.
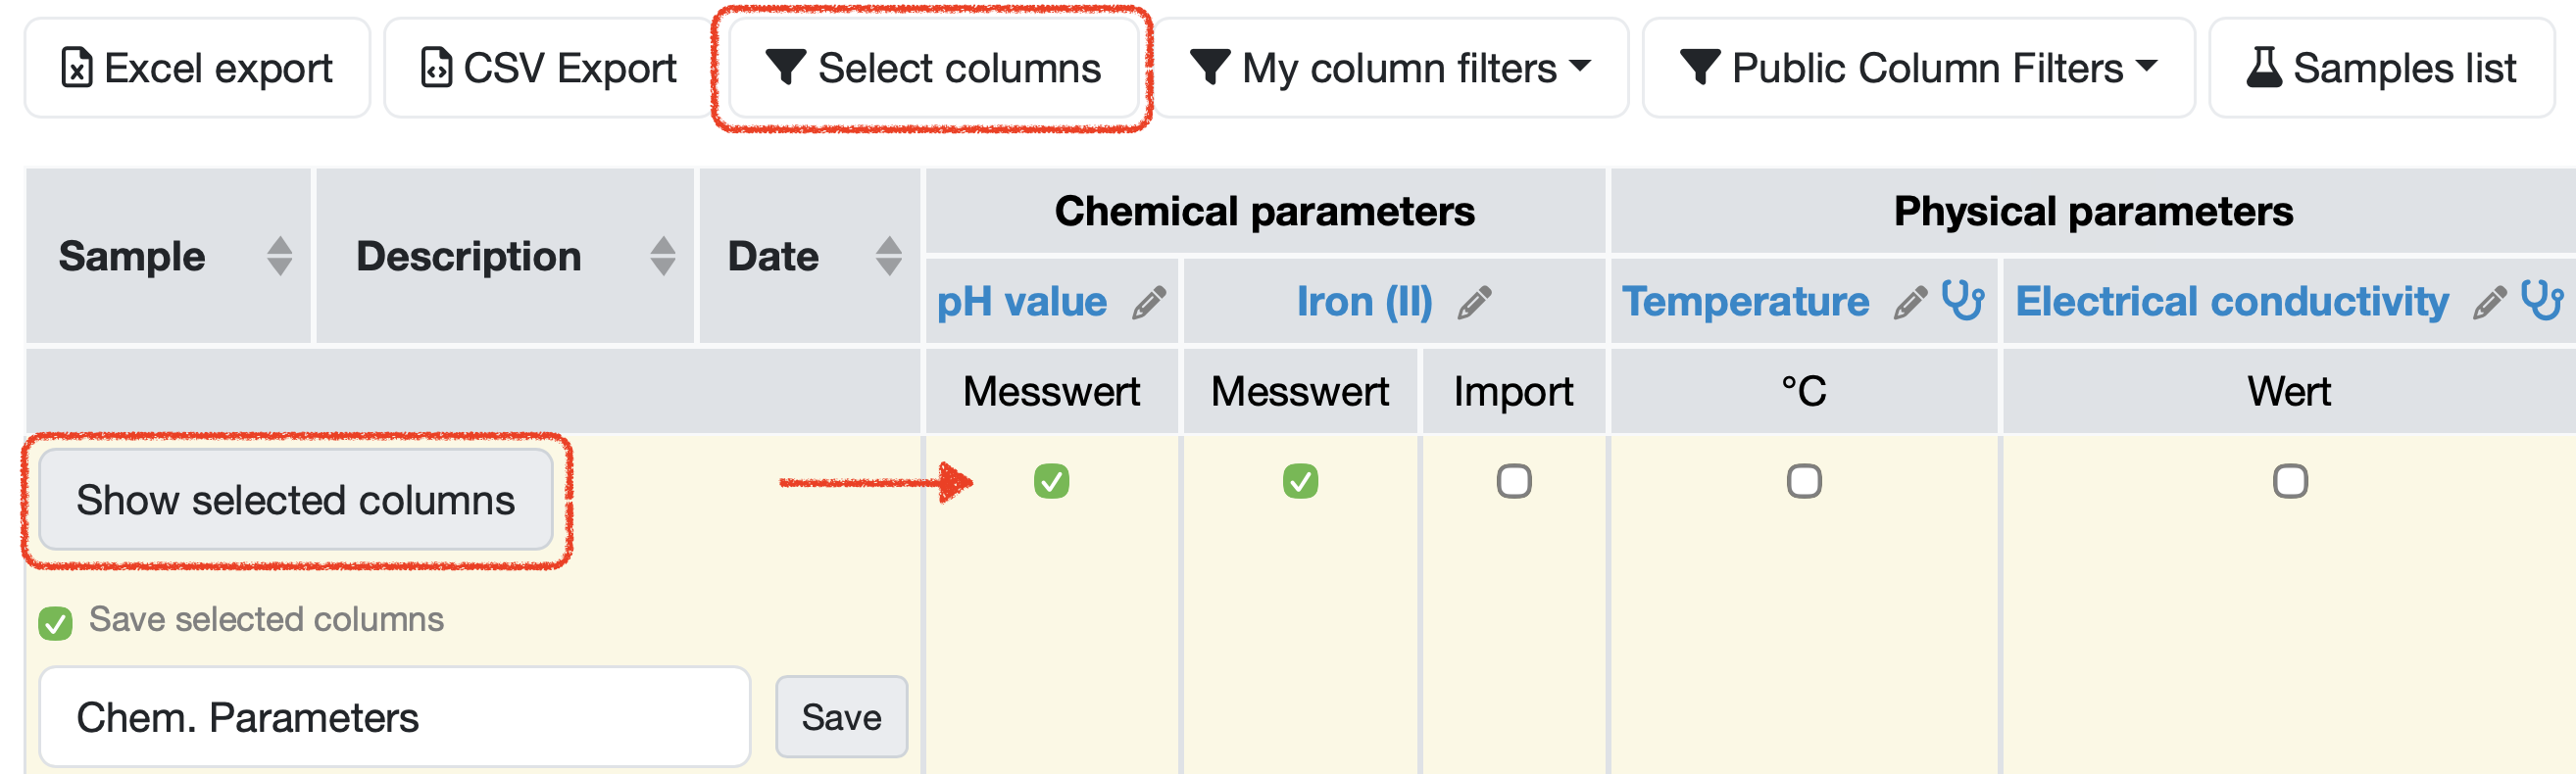
Figure: Select columns individually
Using Column Filters
Saved column filters enable quick switching between frequently used column views.
My Column Filters
- Click the My column filters dropdown to access your personally saved filters.
- Select a filter from the list to adjust the Results table accordingly.
- Via the Manage filters entry you can access filter management.
Public Column Filters
- Click the Public Column Filters dropdown to use system-wide shared filters.
- The currently active filter is highlighted in the list.
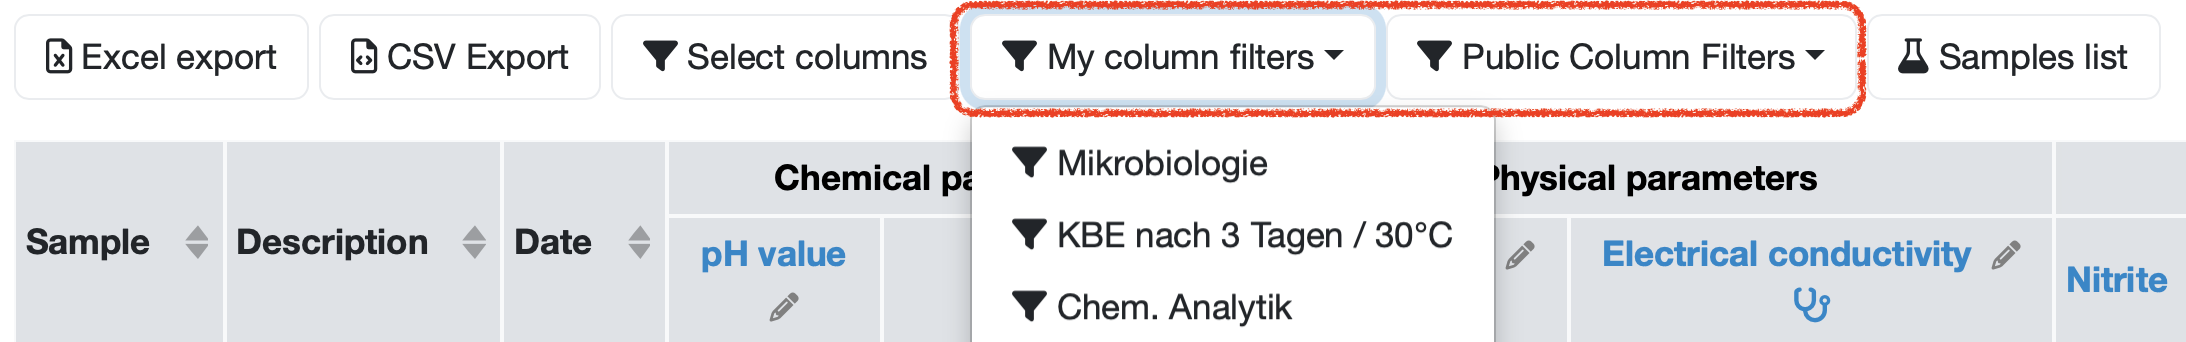
Figure: Column filters
Additional Information: LINK_TO_PAGE=60
Chart
In the LDB, you can display trends, correlations and histograms as charts, and view statistical key figures (standard deviation, variance, Cp, CpK, etc.). The chart shows the measured values of your samples as a graphical trend, allowing you to assess trends, outliers and compliance with target values at a glance. A tabular overview of the underlying measured values is also available.
- Click on the blue-highlighted name of a parameter in the header row of the Results table to open the chart for that parameter.
Additional Information: Charts and Statistical Key Figures
Bulk Editing of Samples
Click the Edit Samples button (orange, top right) to access the view for bulk editing of all samples displayed in the Results table.

Figure: Edit Samples button
The following describes the functions available to you in the Edit Samples collectively screen:
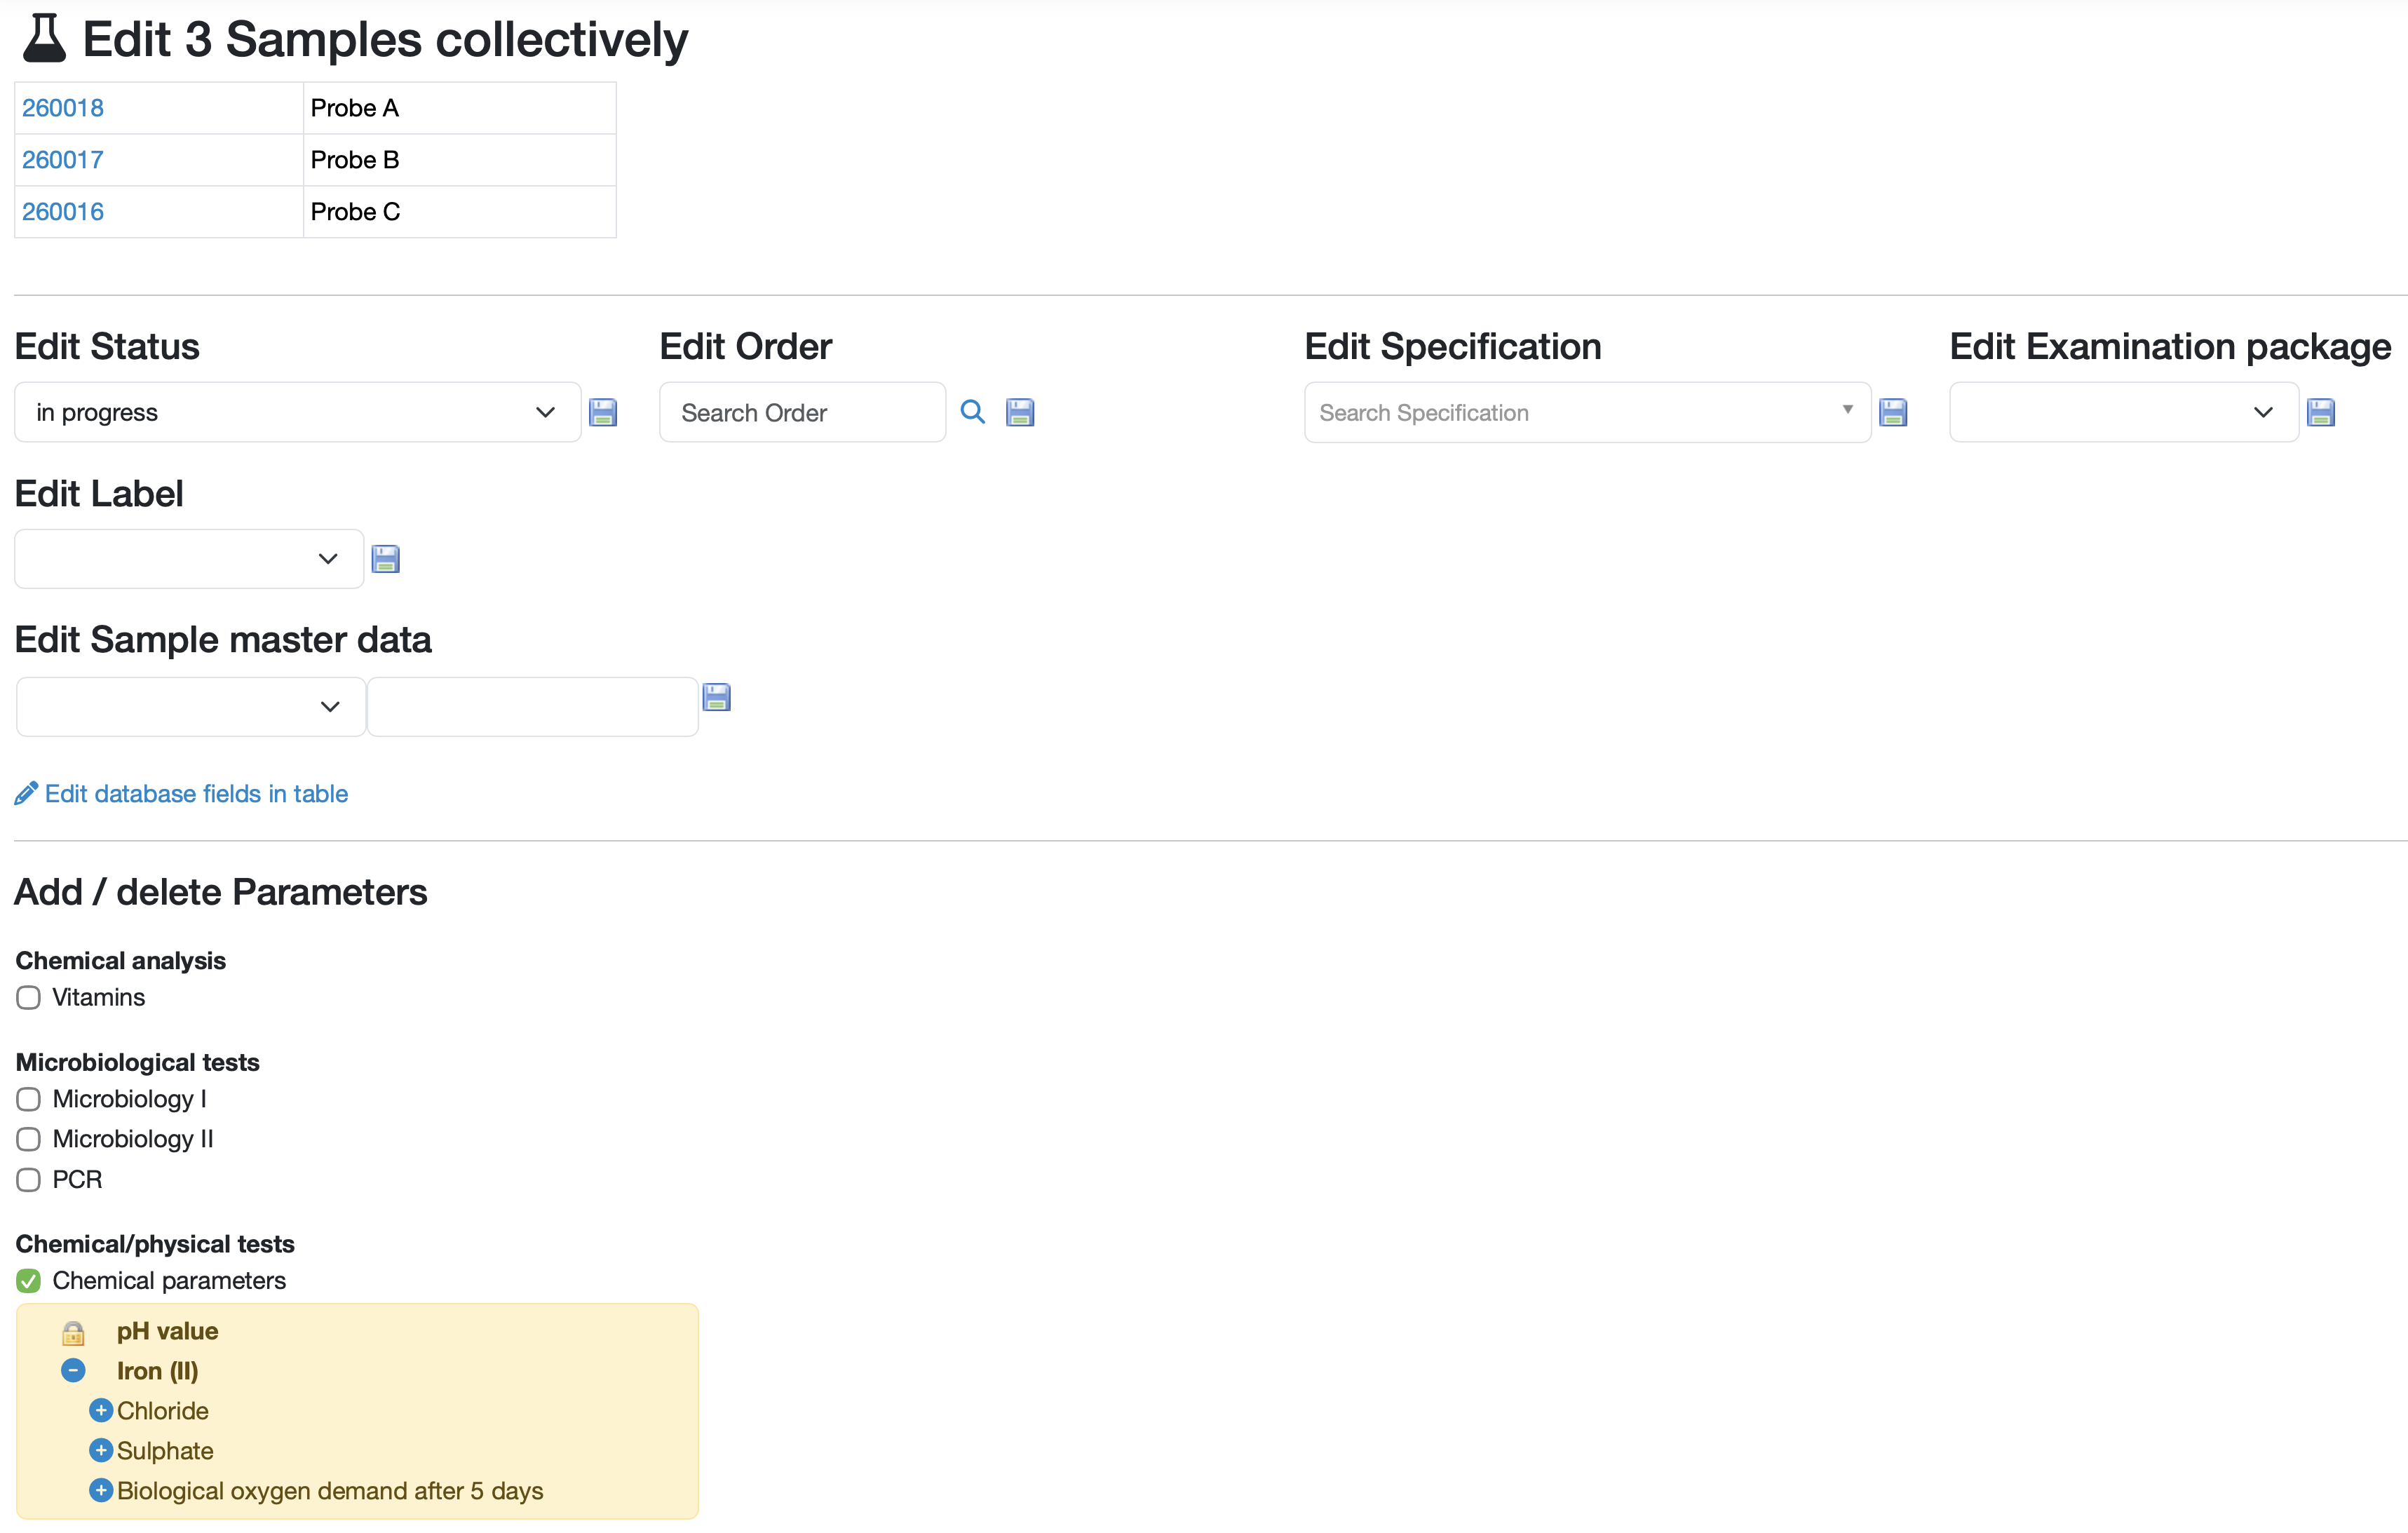
Figure: Edit Samples
1. Edit Sample Master Data for all selected samples simultaneously
- Change Sample Master Data such as status, order, specification, labels, examination packages and further for all selected samples simultaneously.
- Click the save icon (floppy disk) next to the respective field to apply the change.
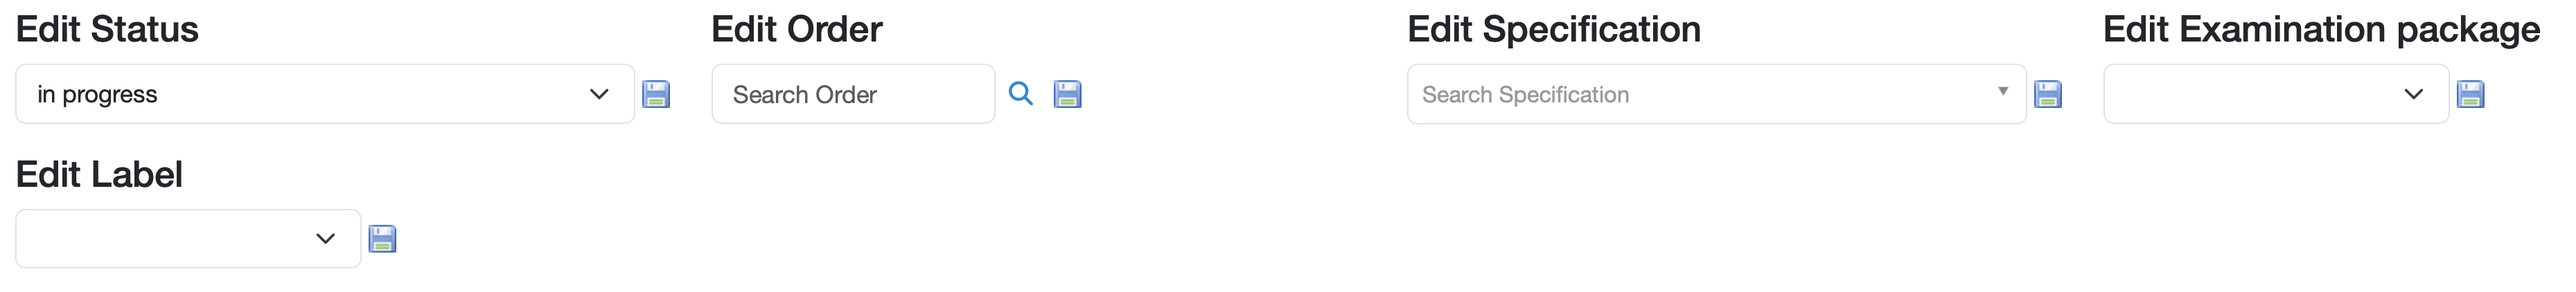
Figure: Edit master data simultaneously
2. Edit Master Data in a Table
Edit the master data of multiple samples in a table view.
- Click the Edit master data in table link in the Edit Samples view.
- In the table view that appears, select the master data fields to be displayed.
- Click the Show column selection button to display the master data of all selected samples in tabular form.
- Make the desired changes and save the data when finished.
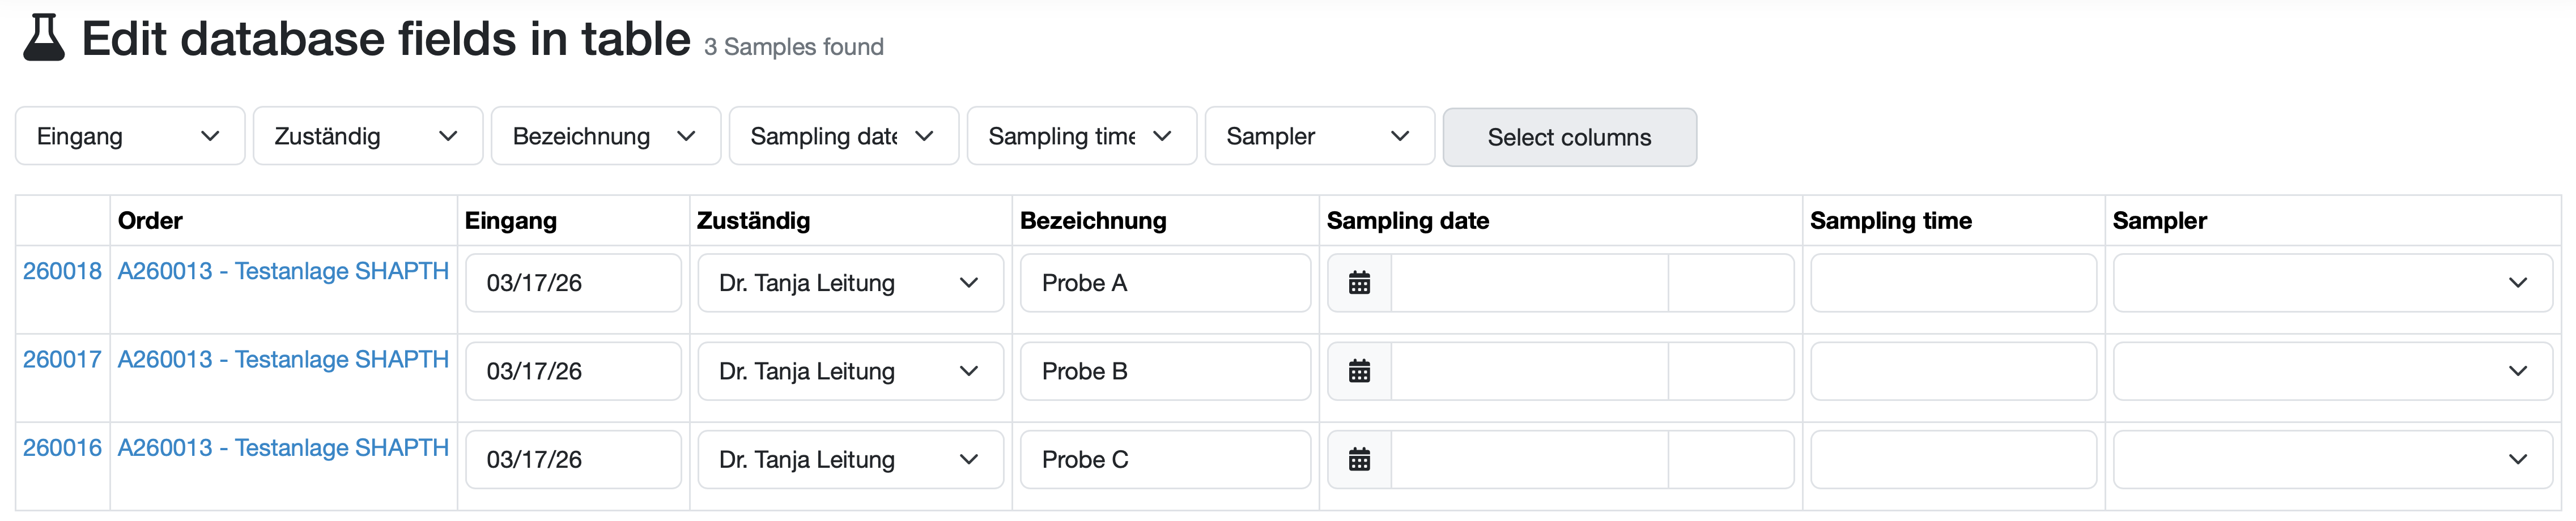
Figure: Edit master data in table
3. Adding / Removing Parameters
Add parameters to the selected samples or remove them.
- Click the plus icon next to a parameter to add it to all selected samples.
- Click the minus icon next to a parameter to remove it from all selected samples.
- The change is saved automatically.
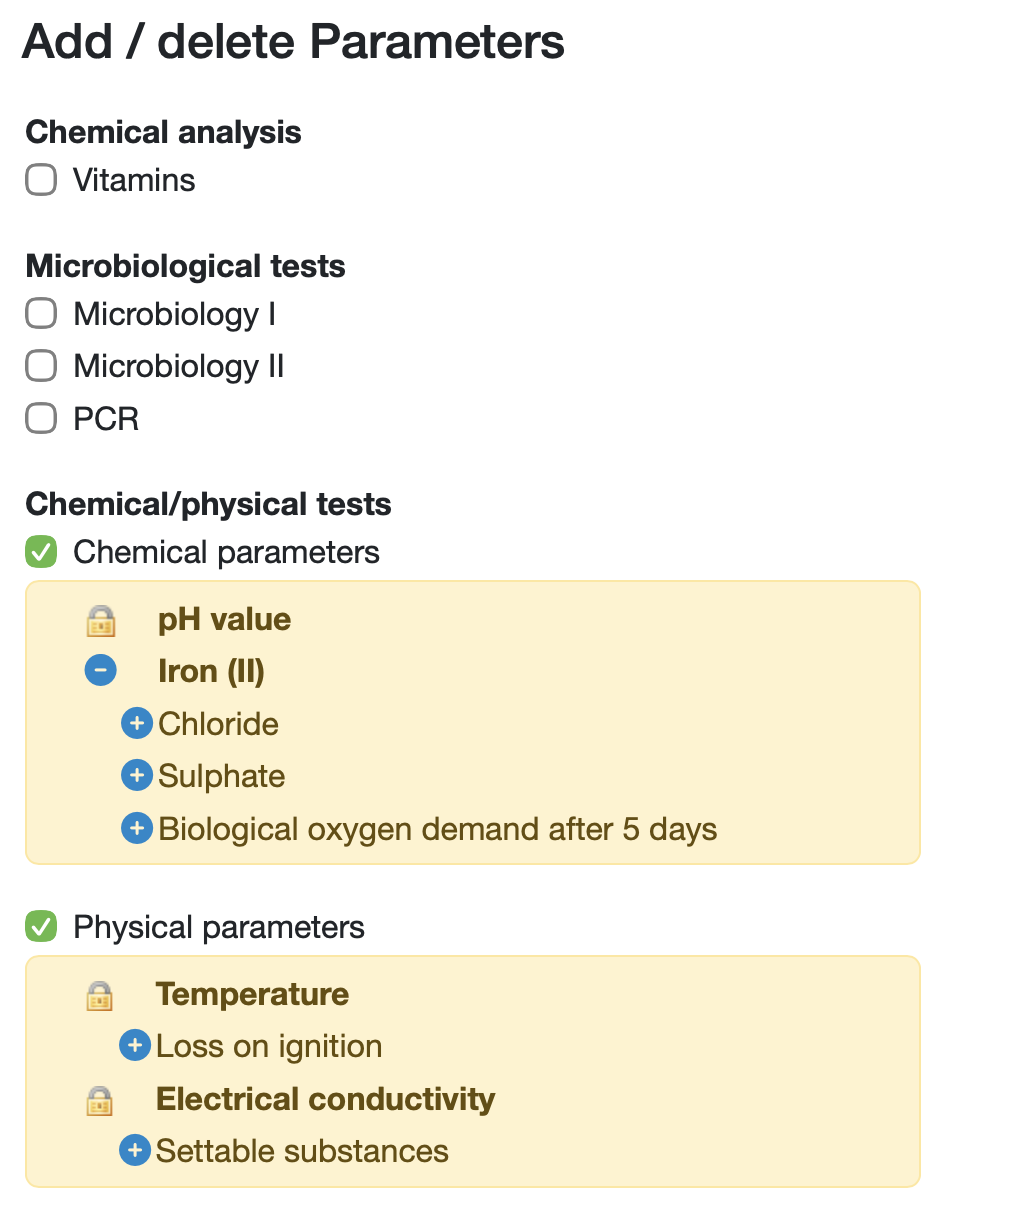
Abbildung : Add / Delete Parameters
Note: Parameters with already entered measured values can no longer be removed. (Indicated by the lock icon.)
4. Deleting Samples
Delete all selected samples collectively using the function in the Edit Samples view.
- Click Delete all samples.
- Optionally enter a reason for the deletion.
- Deleted samples are moved to the recycle bin and can be restored if needed.
Bulk Editing of Samples – from the Samples List
The bulk editing view can also be accessed directly from the Samples list:
- Open the Samples list.
- Select the desired samples using the respective checkboxes.
- Click edit at the bottom of the Samples list.
The Edit Samples view that then appears provides the functions described above.
Switch to Samples List
- Click the Samples list button in the top menu bar to switch to the sample list
Export Functions
Excel Export
- Click the Excel export button in the top menu bar.
- The currently displayed table view, including any active column selection, is downloaded as an Excel file.
CSV Export
- Click the CSV Export button to export the data in CSV format.
Last change: 07/18/26
General information
- Main menu
- Dashboard
- Backup / Data protection
- Version number of the LDB
- Supported browsers
- Activation of SSO
- Print labels
- Automatic LDB validations
- Create/Edit/Delete Categories
- Status management
- SMTP Configuration
- Konfiguration SMTP via OAuth 2.0
- IT requirements for the use of the Labordatenbank
- Add Dashboard Widgets
- Evaluation criteria for suppliers
- Edit evaluation criteria for suppliers
- Overview Deleted Records
- Email informations
- Vacation days
- Manage Weekly Hours
- Manage materials
- Onlineorder detailview
- Manage orders
- Edit orders
- Edit process key figures
- Create process key figures
- Manage 8D-Reports
- Process management view editing
- Edit processes
- Manage Projects
- Edit projects
- Edit planned order
- Edit planned samples
- Tag management
Samples
- Manage samples
- Add/Edit/Delete samples
- Enter values
- Results table
- Charts and Statistical Key Figures
- Manage Filters
- Edit - Search Filters and Column Filters
- Map pooled samples in LIMS
- Manage Stations
- Create / edit / delete station
- Book samples into a station
PDF templates
- Manage PDF Templates
- Create/edit PDF templates
- Create design elements
- Design elements Setting options
- Integrate report tables into PDF template
- Design element for the reason for reissuing test reports
- PDF template for sample labels
Employees
- Manage employees
- Add/edit/archive employee
- Manage employee groups
- Edit employee group
- Create task
- Audit Trail: traceable documentation of all work
- Access rights
- Edit Accessright
- Time tracking - Create hours entry
- Time tracking - Hours per day
- Time tracking - Hours per week
- Time tracking - Annual overview
- Labordatenbank Login / Logout
- Change password
- activate Multi-Factor-Authentification (MFA) with TOTP
- activate a Security Key for the MFA
- Activation of Passkey
- Install TOTP App
- Import employees (introduction phase)
Assets
- Manage assets
- Add/edit/archive asset
- Add subassets to asset
- Add Planned Order and Sample
- Add tests to order templates
- Copy assets, order templates, and asset components
- Equipment GPS location
- Add on-site inspection
Recipes
- Manage recipes
- Create/edit recipe
- Recipe detail view and ingredients
- Quality assurance for recipes: testing, evaluating, documenting
Reports
- Create report
- Inserting Images and File Attachments into a Report
- Sign reports
- Request signature
- Reissue of signed reports
- Send reports by e-mail or post
- Protect emails from spam filters
- Verify authenticity of reports and certificates
- Certificate
- Manage signatures
- Create / edit / delete a signature
Report table editor
- Create/edit/delete a report table
- Create / Edit reporttable column
- Creating a parameter table with target values
- Create sample table
- Create table with open structure
- Order of the report tables
- Fonts and character set for PDF reports
- Report tables overview
- Create checklist with report table editor
- Measurement repetitions value selection
Interfaces
- Import Interfaces Overview
- AI Extension for Import Interfaces
- Edit Attributes in Import Mapping
- Import results from measuring instruments
- Create CSV measurement data import interface
- Import measurement data
- Import of samples
- Mode for measured value import
- Automatic FTP/SFTP Import
- Test SFTP/FTP Connection
- Testing the HTTPS Import Interface
- Transformation code for importing other data formats
- Practical example: Import GC/MS measurement values to your LIMS system
- Practical example: Import Biomerieux Vitek antibiogram into LIMS
- Connect Thermo Fisher Chromeleon to LIMS
- Connect PCR to LIMS with plate assignment
- LIMS connection to DEMIS reporting for pathogen detection
- Tips for import interfaces
- Imort pictures in parameters
- Connection of Essentim data loggers
- SHAPTH - Drinking water database report transmission
Kompetenzen
AI functions
- Enable/disable AI integration
- AI Explorer
- Query Explorer
- AI Import: Automatically assign external calibration certificates
- Enable and Use Audit Assistant
Introductory phase
- Labordatenbank introduction checklist
- Labordatenbank data structure
- Implementing the QM-Database
- Import parameters (Introduction phase)
- Import sample master data (Introduction phase)
- Benefits of the LDB Cloud
- configurable master data fields in the LDB
- Transfer files securely to the LDB
Query reports
- Create query reports using a template
- SQL Basic Course
- SQL JOINs
- SQL Basics
- Create / Edit query reports
- Parameter columns
- Variables in query reports
- Export data from query reports
- Link Evaluations
- Query report tables (SQL table and SQL bar chart)
- Save and Display MySQL Backup Locally
- Link evaluations with import interface
Orders
- Create Order
- Add an order using a template
- Add samples with an order template
- Delete order
- Scanning and sending documents to the LDB with QR
- Typical configurations
- Create order templates
- Create orders using templates
- Defining order access rights
- Order schedule
Templates
- Manage templates for samples
- Create/Edit/Add Sample template
- Templates for orders, customers, materials, and other data types
Customers
- E-mail templates for reports and invoices
- Create customer
- Add / Edit / Delete contact persons at customers
- Merging duplicate customers
- Search customers
- Forward emails to the LDB
- Import customers ( introduction phase)
- Delete Customer
Client zone (optional)
Offers
- Create offer
- Add prices and price items
- Appendix with Terms and Conditions and Service Catalog
- Send Offer
Invoices
- Manage invoices
- Create Invoice
- Sending Invoices
- The English translation for "Teilzahlungen bei einer Rechnung erfassen
- Manage price list
- Exporting invoices
- Import billing items (Introduction phase)
- Create revenue centers for prices
- Activate X-invoice / E-invoice for Germany
- Create Collective Invoices
- Cancel invoice
- QR code for online banking on invoices
- Suggest billing items
Parameters
- Manage Parameters
- Parameter Detail View
- Add/Edit/Delete Parameter
- Create/edit/delete parameter group
- Daily Parameter List: What has to be done in the laboratory
- Parameter usage statistics
- Labeling of subcontracting and accreditation
- Parameter data types
- portray proficiency tests
- Manage examination packages
- Create/Edit examination packages
Calculating with parameters
- Deposit formulas with parameters
- Calculating with number sequences
- Calculation of dry matter and annealing loss
- Calculating with Date/Time Information
- Example: Weighing in and weighing out
- Example: Calculation of annealing loss with validity check
- Example: Determination of Chemical Oxygen Demand
- Example: Determination of TVC - aerobic mesophilic total viable count
- Bsp.: Drinkingwater-Legionella since March 2023 (German Regulation)
Webservices
- LDB Webservices
- Provide data as web services for external systems
- Send data to an external web service
- Send data to the Labordatenbank
- Example: Send eTermin to the LDB
- Example: JSON file for creating samples
Transformationscode
- General structure of a transformation code
- Transformation code for evaluations
- Export transformation code
- Webservice Response Handler
- Import transformation code
Test plans / limit values / specifications
- Create test plan / limit value table / specification
- Add specification limits / reference ranges
- Measurement value evaluation based on reference range values
- Detect and filter reference range deviations
- Parameter-specific text modules according to limit tables
Documents control
- Create a New Document
- Create new version
- Validate document
- Release Document
- Request read confirmation
- Import documents (Introduction phase)
- Change the document creator afterwards
- Delete documents
- Documents: Confirm validity check
Material
- Functions of Material Management
- Create/edit/delete material
- Linking materials with parameters
- Reorder Materials Online
- Management of chemicals
- Manage/Create/Edit/Delete Batches
- Use batch samples
Questions and answers
- IT requirements
- Where can I find the current version number of the _LABORDATENBANK__?
- How can I calculate the average from five measured values?
- Where do you enter titles like Dr/Prof/Dipl. etc.?
- How can I change the order of parameters in the packages?
- Querious: Delete archived reports
- Download files in the Edge browser instead of opening them directly
- Transfer the status of the production system to the test system
Equipment
- Test Equipment Management
- Test equipment detailed view
- Add/edit/delete Test Equipment
- Import test equipment (introduction phase)
- Create control charts
- Import control values from test equipment
- Print labels for test equipment
- Forward emails to test equipment
- Booking Test Equipment
- Test Equipment Calendar
Trainings
- TrainingSchedule: Document Training Sessions, Demonstrate Competencies
- Add/edit/delete training
- Import Trainings (Introduction phase)
8D-report
Others
Supplier evaluation
File management
- Add Files (to Samples, Customers, Orders)
- Add Files (Test Equipment, Material, Batches, Specifications)
- File Management
- Search data
Processes