Add specification limits / reference ranges
Specification Limits in Practice
For specification limits to be applied during measurement entry, the corresponding specification must be selected for the sample.
The specification limits are then integrated into the LDB view where you enter measured values, and the measured values are automatically compared against the specification limits.

Benefits in daily work:
- At a glance, you can see whether measured values are within the valid range. Deviating measured values are automatically highlighted in your chosen color (red, orange, green).
- The marking of deviating measured values is possible both when entering measured values and in the report.
- Immediate response to critical values is possible.
The following describes how to define specification limits/reference ranges:
Select or Create Specification
To create specification limits in your LDB, you first need a specification (reference range table). Click edit on the desired specification or add a new one via + Create Specification.
Define Specification Limits
Select Parameter
There are two ways to add parameters:
1. Targeted Search
- Click on the dropdown menu Search Parameter.
- Select the desired parameter from the list.

2. Use Overview
- Click on Show All Parameters.
- Add parameters by clicking on the blue plus symbol to the right of the desired parameter.

- You will then automatically access the view where you can create rules for the parameter and thus define the specification limit.
Create Specification Limit for Parameter
With specification limits, you can define reference ranges for each parameter in the LDB and have deviations marked in color.
How to create a specification limit for the previously selected parameter:
- Select the parameter column to which the specification limit refers in the first dropdown menu.
- Select the operator (
=, <, >, ≤, ≥, !=) in the second dropdown menu. - Enter the specification limit in the third field. If a dropdown menu is configured for the selected parameter column, for example, you can select the specification limit directly from the dropdown menu.
- For ranges, you can combine multiple conditions. Use the fourth dropdown menu for this and select
ANDorORas the connector.
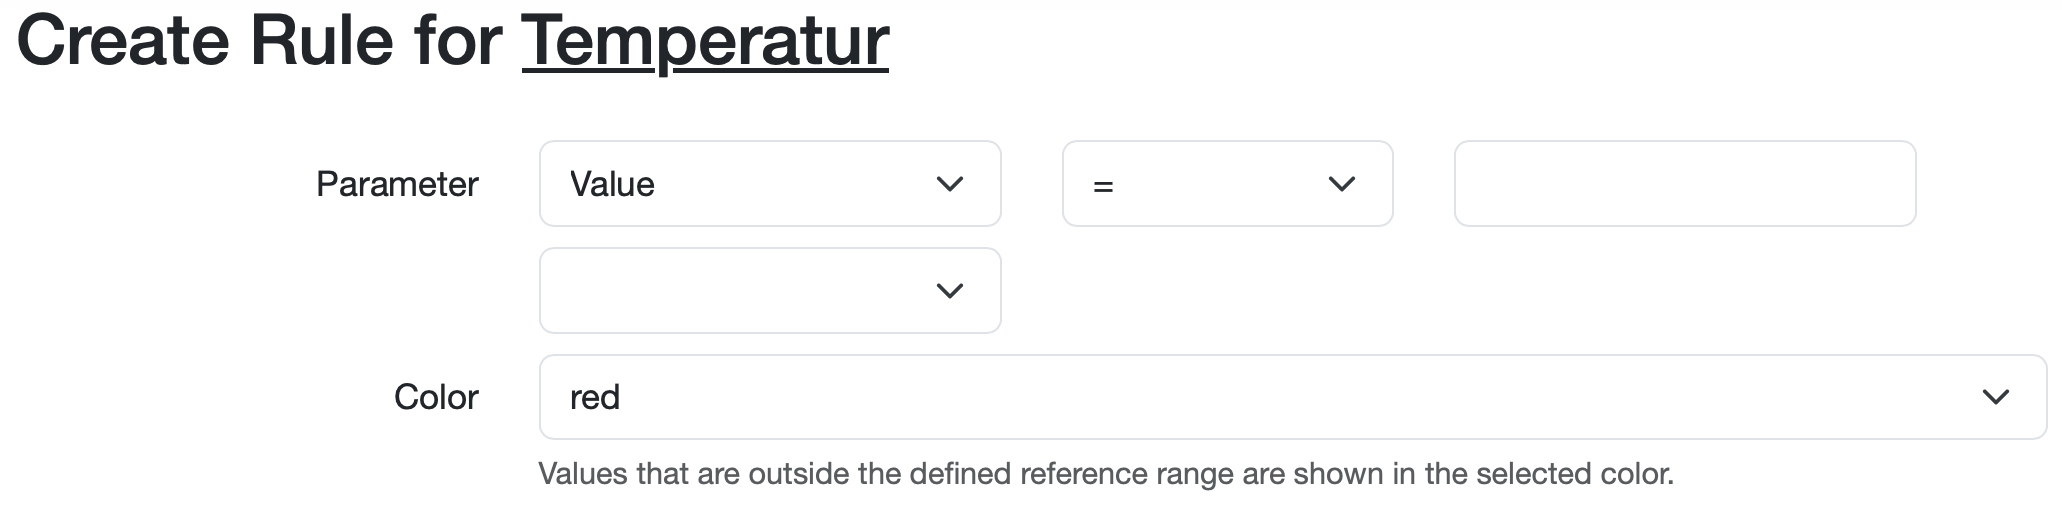
Note: In the standard configuration of the LDB, you always define the valid reference range. Only values that lie outside this range are marked with the selected color.
Below you will find the most common use cases:
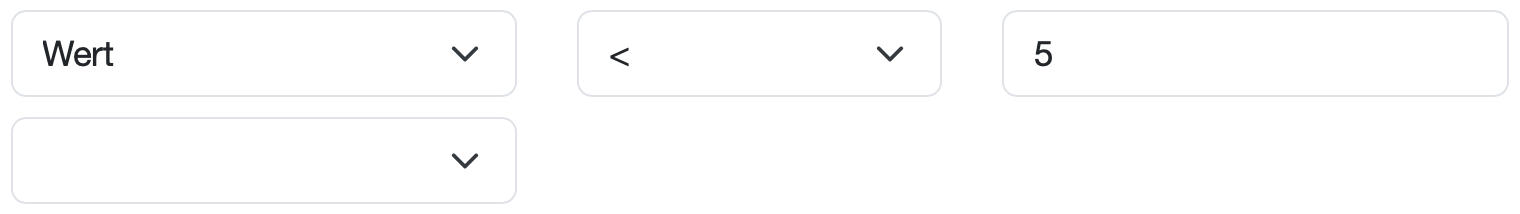
Maximum Value (Upper Limit)
Use case: A value must not exceed a certain maximum value.
Example: The temperature should remain below 5 °C.
- Rule:
Value < 5 - Result: Values ≥ 5 °C (e.g. 8 °C) are automatically marked in the selected color.
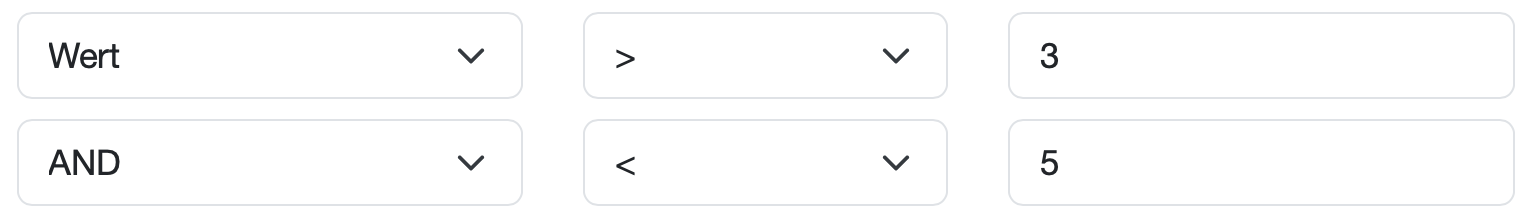
Range (Between Two Values)
Use case: A value must lie within a defined range.
Example: The temperature should be between 3 °C and 5 °C.
- Rule:
Value > 3 AND < 5 - Use the AND function (AND) with corresponding comparison operators.
- Result: Values ≤ 3 °C or ≥ 5 °C are automatically marked in color.
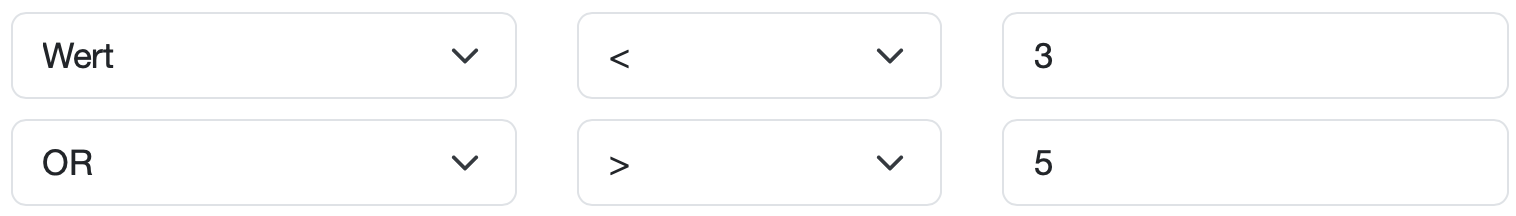
Outside a Range
Use case: Only values outside a certain range are valid.
Example: The temperature should be either below 3 °C or above 5 °C.
- Rule:
Value < 3 OR > 5 - Use the OR function (OR) with corresponding comparison operators.
- Result: Values between 3 °C and 5 °C are automatically marked in color.
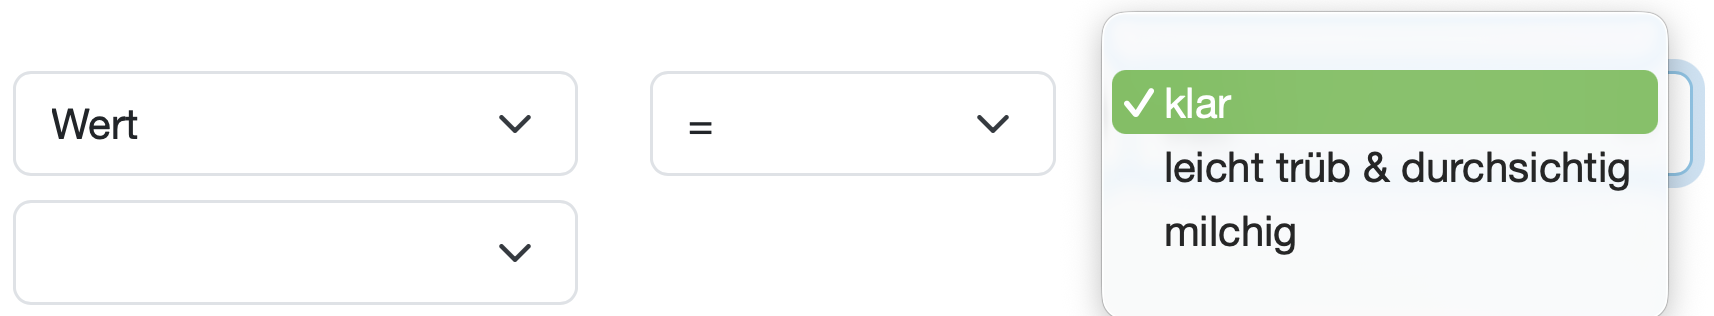
Fixed Value (Exact Match)
Use case: A text value or selection option must match exactly.
Example: For visual inspection, only clear is accepted as valid.
- Rule:
Value = clear - Use = for equality or != for inequality.
- Result: All values except clear are automatically marked in color.
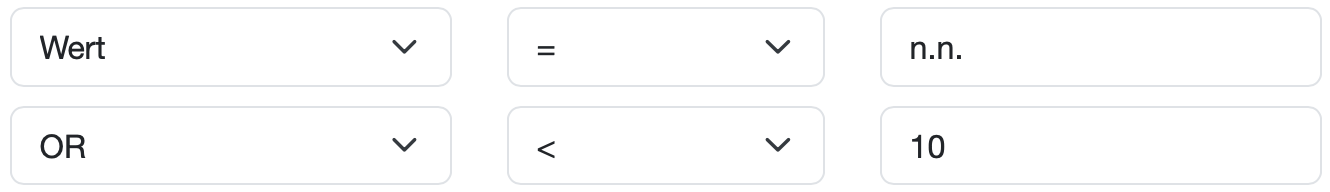
Combination of Text and Numbers
Use case: Both text values and numeric values are defined as valid for a parameter.
Example: For microbial count determinations, the result can be either "nd" (not detectable) or a numerical value below 10
- Rule:
= n.d. OR < 10(< 10 OR = n.d. doesn't work) - Use the OR function (OR) for linking
- Important: The text comparison must be in first position.
- Result: Both the text n.d. and all numerical values < 10 are considered valid. All other values are automatically marked in color.
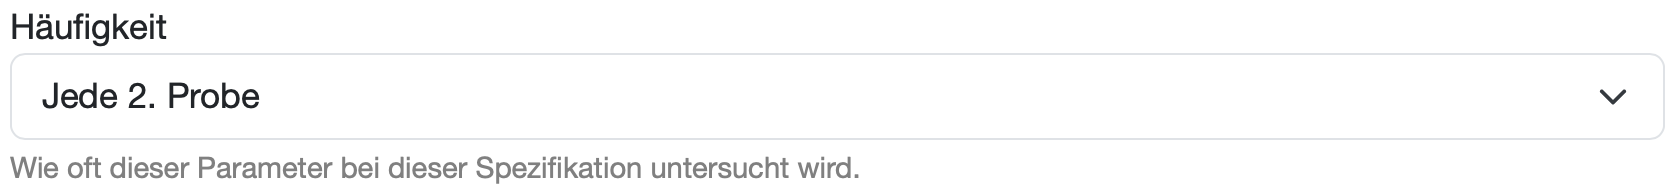
Set Frequency
Define the frequency with which the specification limit must be met in tested samples.
Example: The specification limit must be met in every 2nd sample.
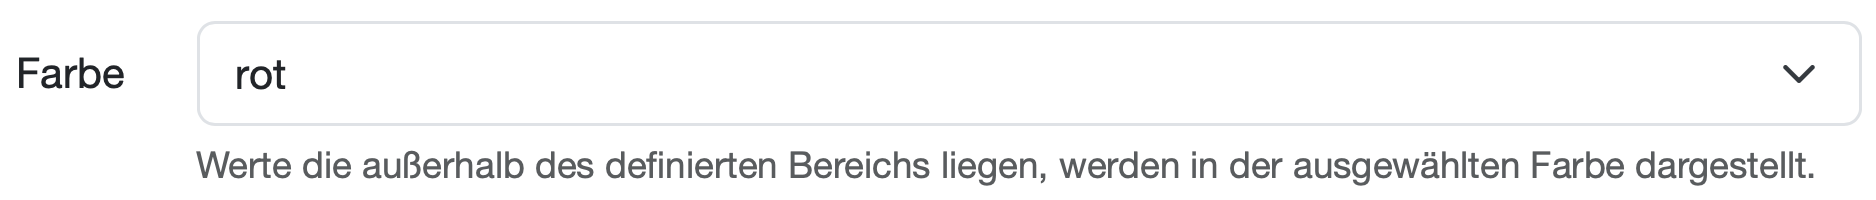
Choose Color Coding
Select the color in which values that do not meet the specification limit should be displayed (red by default). This enables quick visual detection of deviations.
Activate Report Integration
Check the checkbox show this rule in report to display the specification limits together with the measured values in reports.

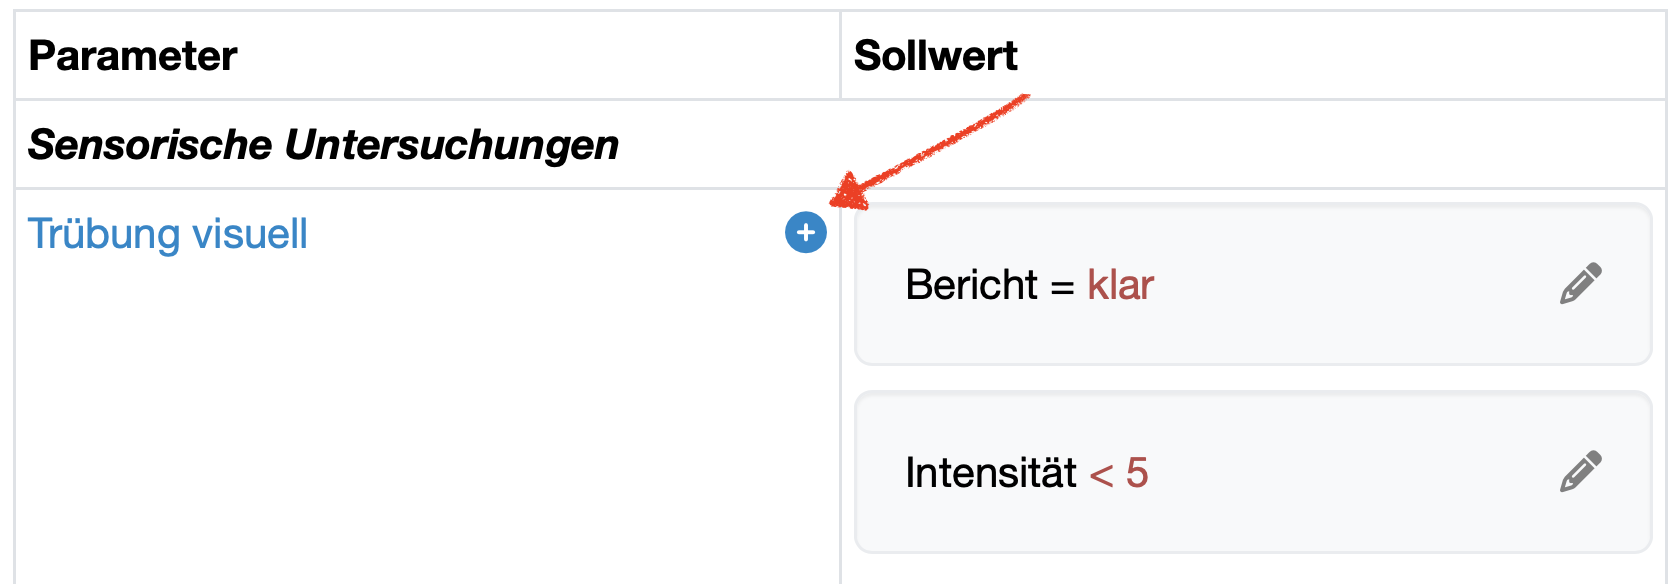
Add Additional Specification Limits
After saving, you can add additional specification limits for the same parameter if needed:
- Click on the + next to the parameter
- Define additional rules using the same schema
This is useful when you need different specification limits for different situations (e.g. warning and limit values).
Last change: 07/29/26
General information
- Main menu
- Dashboard
- Backup / Data protection
- Version number of the LDB
- Supported browsers
- Activation of SSO
- Print labels
- Automatic LDB validations
- Create/Edit/Delete Categories
- Status management
- SMTP Configuration
- Konfiguration SMTP via OAuth 2.0
- IT requirements for the use of the Labordatenbank
- Add Dashboard Widgets
- Evaluation criteria for suppliers
- Edit evaluation criteria for suppliers
- Deleted Records
- Email informations
- Vacation days
- Manage Weekly Hours
- Manage materials
- Onlineorder detailview
- Edit process key figures
- Create process key figures
- Manage 8D-Reports
- Process management view editing
- Edit processes
- Manage Projects
- Edit projects
- Edit planned order
- Edit planned samples
- Tag management
Orders
- Manage orders
- Order Detail View
- Create/edit/delete Order
- Scanning and sending documents to the LDB with QR
- Order schedule
Samples
- Manage samples
- Add/Edit/Delete samples
- Enter values
- Results table
- Charts and Statistical Key Figures
- Manage Filters
- Edit - Search Filters and Column Filters
- Map pooled samples in LIMS
- Manage Stations
- Create / edit / delete station
- Book samples into a station
PDF templates
- Manage PDF Templates
- Create/edit PDF templates
- Create design elements
- Design elements Setting options
- Integrate report tables into PDF template
- Design element for the reason for reissuing test reports
- PDF template for sample labels
Employees
- Manage employees
- Add/edit/archive employee
- Manage employee groups
- Edit employee group
- Create task
- Audit Trail: traceable documentation of all work
- Access rights
- Edit Accessright
- Time tracking - Create hours entry
- Time tracking - Hours per day
- Time tracking - Hours per week
- Time tracking - Annual overview
- Labordatenbank Login / Logout
- Change password
- activate Multi-Factor-Authentification (MFA) with TOTP
- activate a Security Key for the MFA
- Activation of Passkey
- Install TOTP App
- Import employees (introduction phase)
Assets
- Manage assets
- Add/edit/archive asset
- Add subassets to asset
- Add Planned Order and Sample
- Add tests to order templates
- Copy assets, order templates, and asset components
- Equipment GPS location
- Add on-site inspection
Recipes
- Manage recipes
- Create/edit recipe
- Recipe detail view and ingredients
- Quality assurance for recipes: testing, evaluating, documenting
Reports
- Create report
- Inserting Images and File Attachments into a Report
- Sign reports
- Request signature
- Reissue of signed reports
- Send reports by e-mail or post
- Protect emails from spam filters
- Verify authenticity of reports and certificates
- Certificate
- Manage signatures
- Create / edit / delete a signature
Report table editor
- Create/edit/delete a report table
- Create / Edit reporttable column
- Creating a parameter table with target values
- Create sample table
- Create table with open structure
- Order of the report tables
- Fonts and character set for PDF reports
- Create checklist with report table editor
- Measurement repetitions value selection
Interfaces
- Import Interfaces Overview
- AI Extension for Import Interfaces
- Edit Attributes in Import Mapping
- Import results from measuring instruments
- Create CSV measurement data import interface
- Import measurement data
- Import of samples
- Mode for measured value import
- Automatic FTP/SFTP Import
- Test SFTP/FTP Connection
- Testing the HTTPS Import Interface
- Transformation code for importing other data formats
- Practical example: Import GC/MS measurement values to your LIMS system
- Practical example: Import Biomerieux Vitek antibiogram into LIMS
- Connect Thermo Fisher Chromeleon to LIMS
- Connect PCR to LIMS with plate assignment
- LIMS connection to DEMIS reporting for pathogen detection
- Tips for import interfaces
- Imort pictures in parameters
- Connection of Essentim data loggers
- SHAPTH - Drinking water database report transmission
Kompetenzen
AI functions
- Enable/disable AI integration
- AI Explorer
- Query Explorer
- AI Import: Automatically assign external calibration certificates
- Enable and Use Audit Assistant
Introductory phase
- Labordatenbank introduction checklist
- Labordatenbank data structure
- Implementing the QM-Database
- Import parameters (Introduction phase)
- Import sample master data (Introduction phase)
- Benefits of the LDB Cloud
- Configurable attribute fields in the LDB
- Transfer files securely to the LDB
Query reports
- Create query reports using a template
- SQL Basic Course
- SQL JOINs
- SQL Basics
- Create / Edit query reports
- Parameter columns
- Variables in query reports
- Export data from query reports
- Link Evaluations
- Query report tables (SQL table and SQL bar chart)
- Save and Display MySQL Backup Locally
- Link evaluations with import interface
Templates
- Create order templates
- Manage templates for samples
- Create/Edit/Add Sample template
- Templates for orders, customers, materials, and other data types
Customers
- Manage customers
- Customer Detail View
- Create/edit/delete customer
- Merging duplicate customers
- Add / Edit / Delete contact persons at customers
- E-mail templates for reports and invoices
- Forward emails to the LDB
- Import customers ( introduction phase)
Client zone (optional)
Offers
- Create offer
- Add prices and price items
- Appendix with Terms and Conditions and Service Catalog
- Send Offer
Invoices
- Manage invoices
- Create Invoice
- Sending Invoices
- The English translation for "Teilzahlungen bei einer Rechnung erfassen
- Manage price list
- Exporting invoices
- Import billing items (Introduction phase)
- Create revenue centers for prices
- Activate X-invoice / E-invoice for Germany
- Create Collective Invoices
- Cancel invoice
- QR code for online banking on invoices
- Suggest billing items
Parameters
- Manage Parameters
- Parameter Detail View
- Add/Edit/Delete Parameter
- Create/edit/delete parameter group
- Daily Parameter List: What has to be done in the laboratory
- Parameter usage statistics
- Labeling of subcontracting and accreditation
- Parameter data types
- portray proficiency tests
- Manage examination packages
- Create/Edit examination packages
Calculating with parameters
- Deposit formulas with parameters
- Calculating with number sequences
- Calculation of dry matter and annealing loss
- Calculating with Date/Time Information
- Example: Weighing in and weighing out
- Example: Calculation of annealing loss with validity check
- Example: Determination of Chemical Oxygen Demand
- Example: Determination of TVC - aerobic mesophilic total viable count
- Bsp.: Drinkingwater-Legionella since March 2023 (German Regulation)
Webservices
- LDB Webservices
- Provide data as web services for external systems
- Send data to an external web service
- Send data to the Labordatenbank
- Example: Send eTermin to the LDB
- Example: JSON file for creating samples
Transformationscode
- General structure of a transformation code
- Transformation code for evaluations
- Export transformation code
- Webservice Response Handler
- Import transformation code
Test plans / limit values / specifications
- Create test plan / limit value table / specification
- Add specification limits / reference ranges
- Measurement value evaluation based on reference range values
- Detect and filter reference range deviations
- Parameter-specific text modules according to limit tables
Documents control
- Create a New Document
- Create new version
- Validate document
- Release Document
- Request read confirmation
- Import documents (Introduction phase)
- Change the document creator afterwards
- Delete documents
- Documents: Confirm validity check
Material
- Functions of Material Management
- Create/edit/delete material
- Linking materials with parameters
- Reorder Materials Online
- Management of chemicals
- Manage/Create/Edit/Delete Batches
- Use batch samples
Questions and answers
- IT requirements
- Where can I find the current version number of the _LABORDATENBANK__?
- How can I calculate the average from five measured values?
- How can I change the order of parameters in the packages?
- Querious: Delete archived reports
- Download files in the Edge browser instead of opening them directly
- Transfer the status of the production system to the test system
Equipment
- Test Equipment Management
- Test equipment detailed view
- Add/edit/delete Test Equipment
- Import test equipment (introduction phase)
- Create control charts
- Import control values from test equipment
- Print labels for test equipment
- Forward emails to test equipment
- Booking Test Equipment
- Test Equipment Calendar
Trainings
- TrainingSchedule: Document Training Sessions, Demonstrate Competencies
- Add/edit/delete training
- Import Trainings (Introduction phase)
8D-report
Others
Supplier evaluation
File management
- Add Files (to Samples, Customers, Orders)
- Add Files (Test Equipment, Material, Batches, Specifications)
- File Management
- Search data
Processes