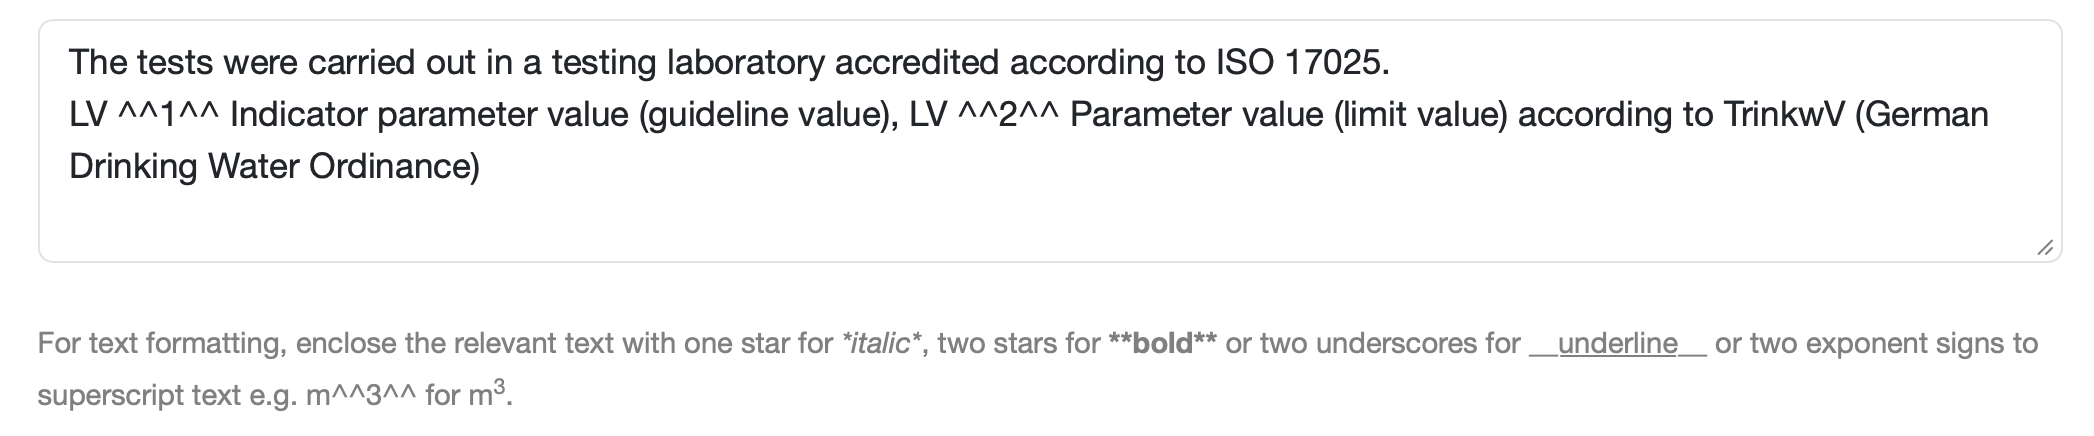
The following describes how to create the table shown here:
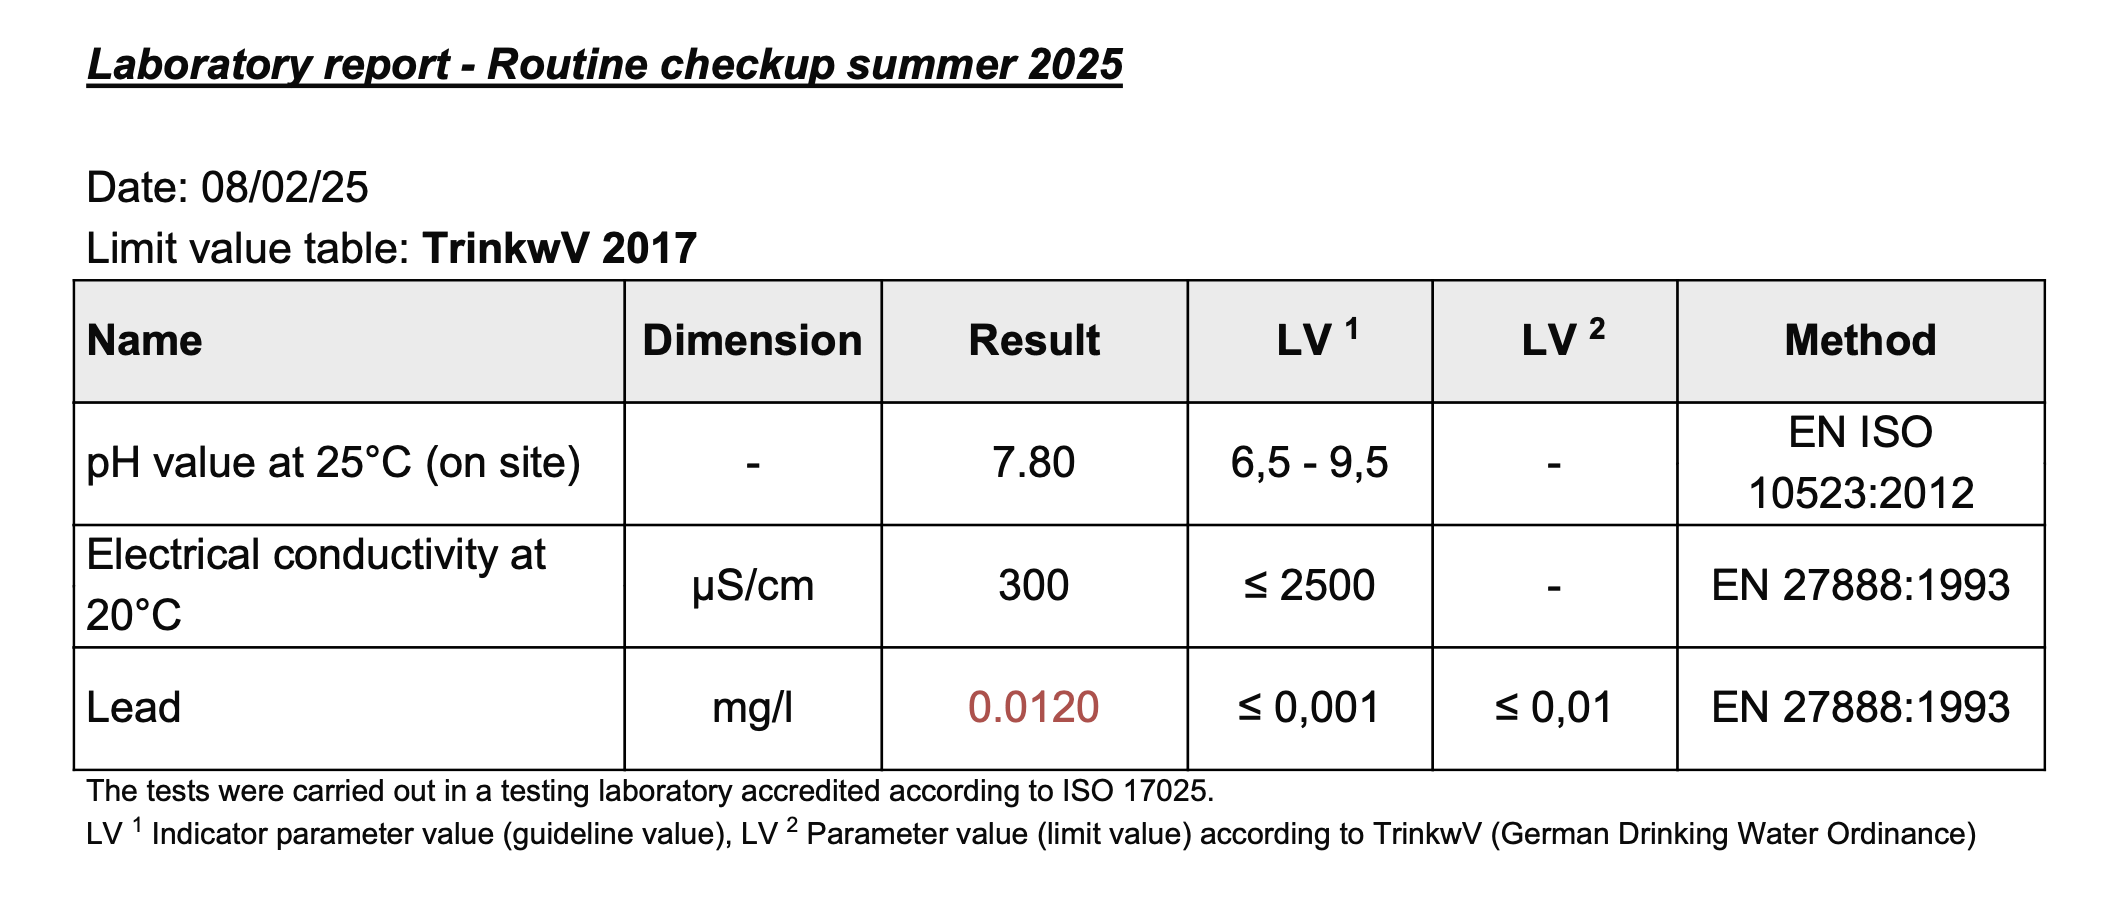
Create the table in the Report Table Editor. (See instructions: Create/edit/delete a report table)
Select Parameter Table as type of table.
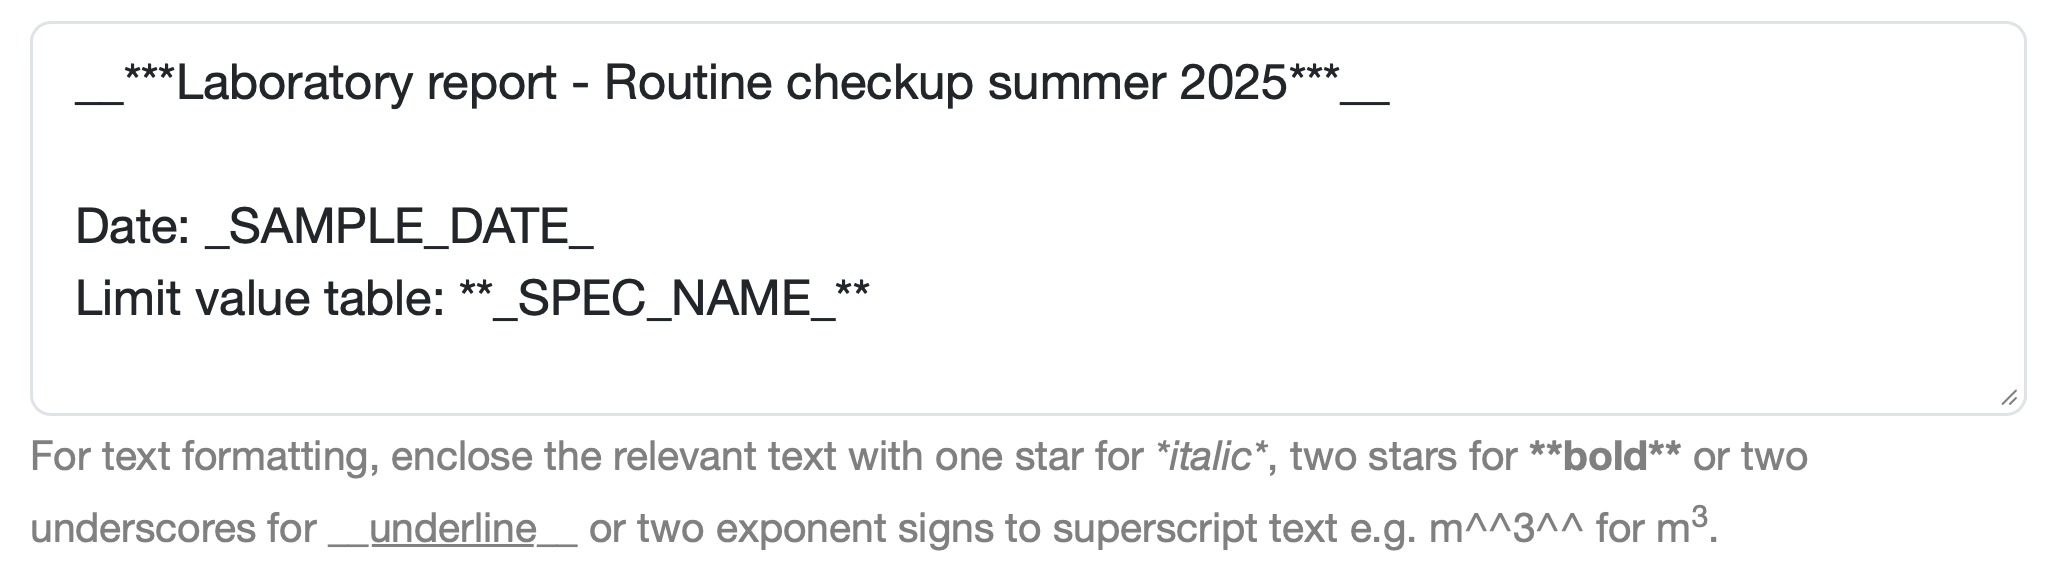
Enter the text for the Header.
Highlight the head by surrounding the text with one asterisk each for italic and two more asterisks each for bold.

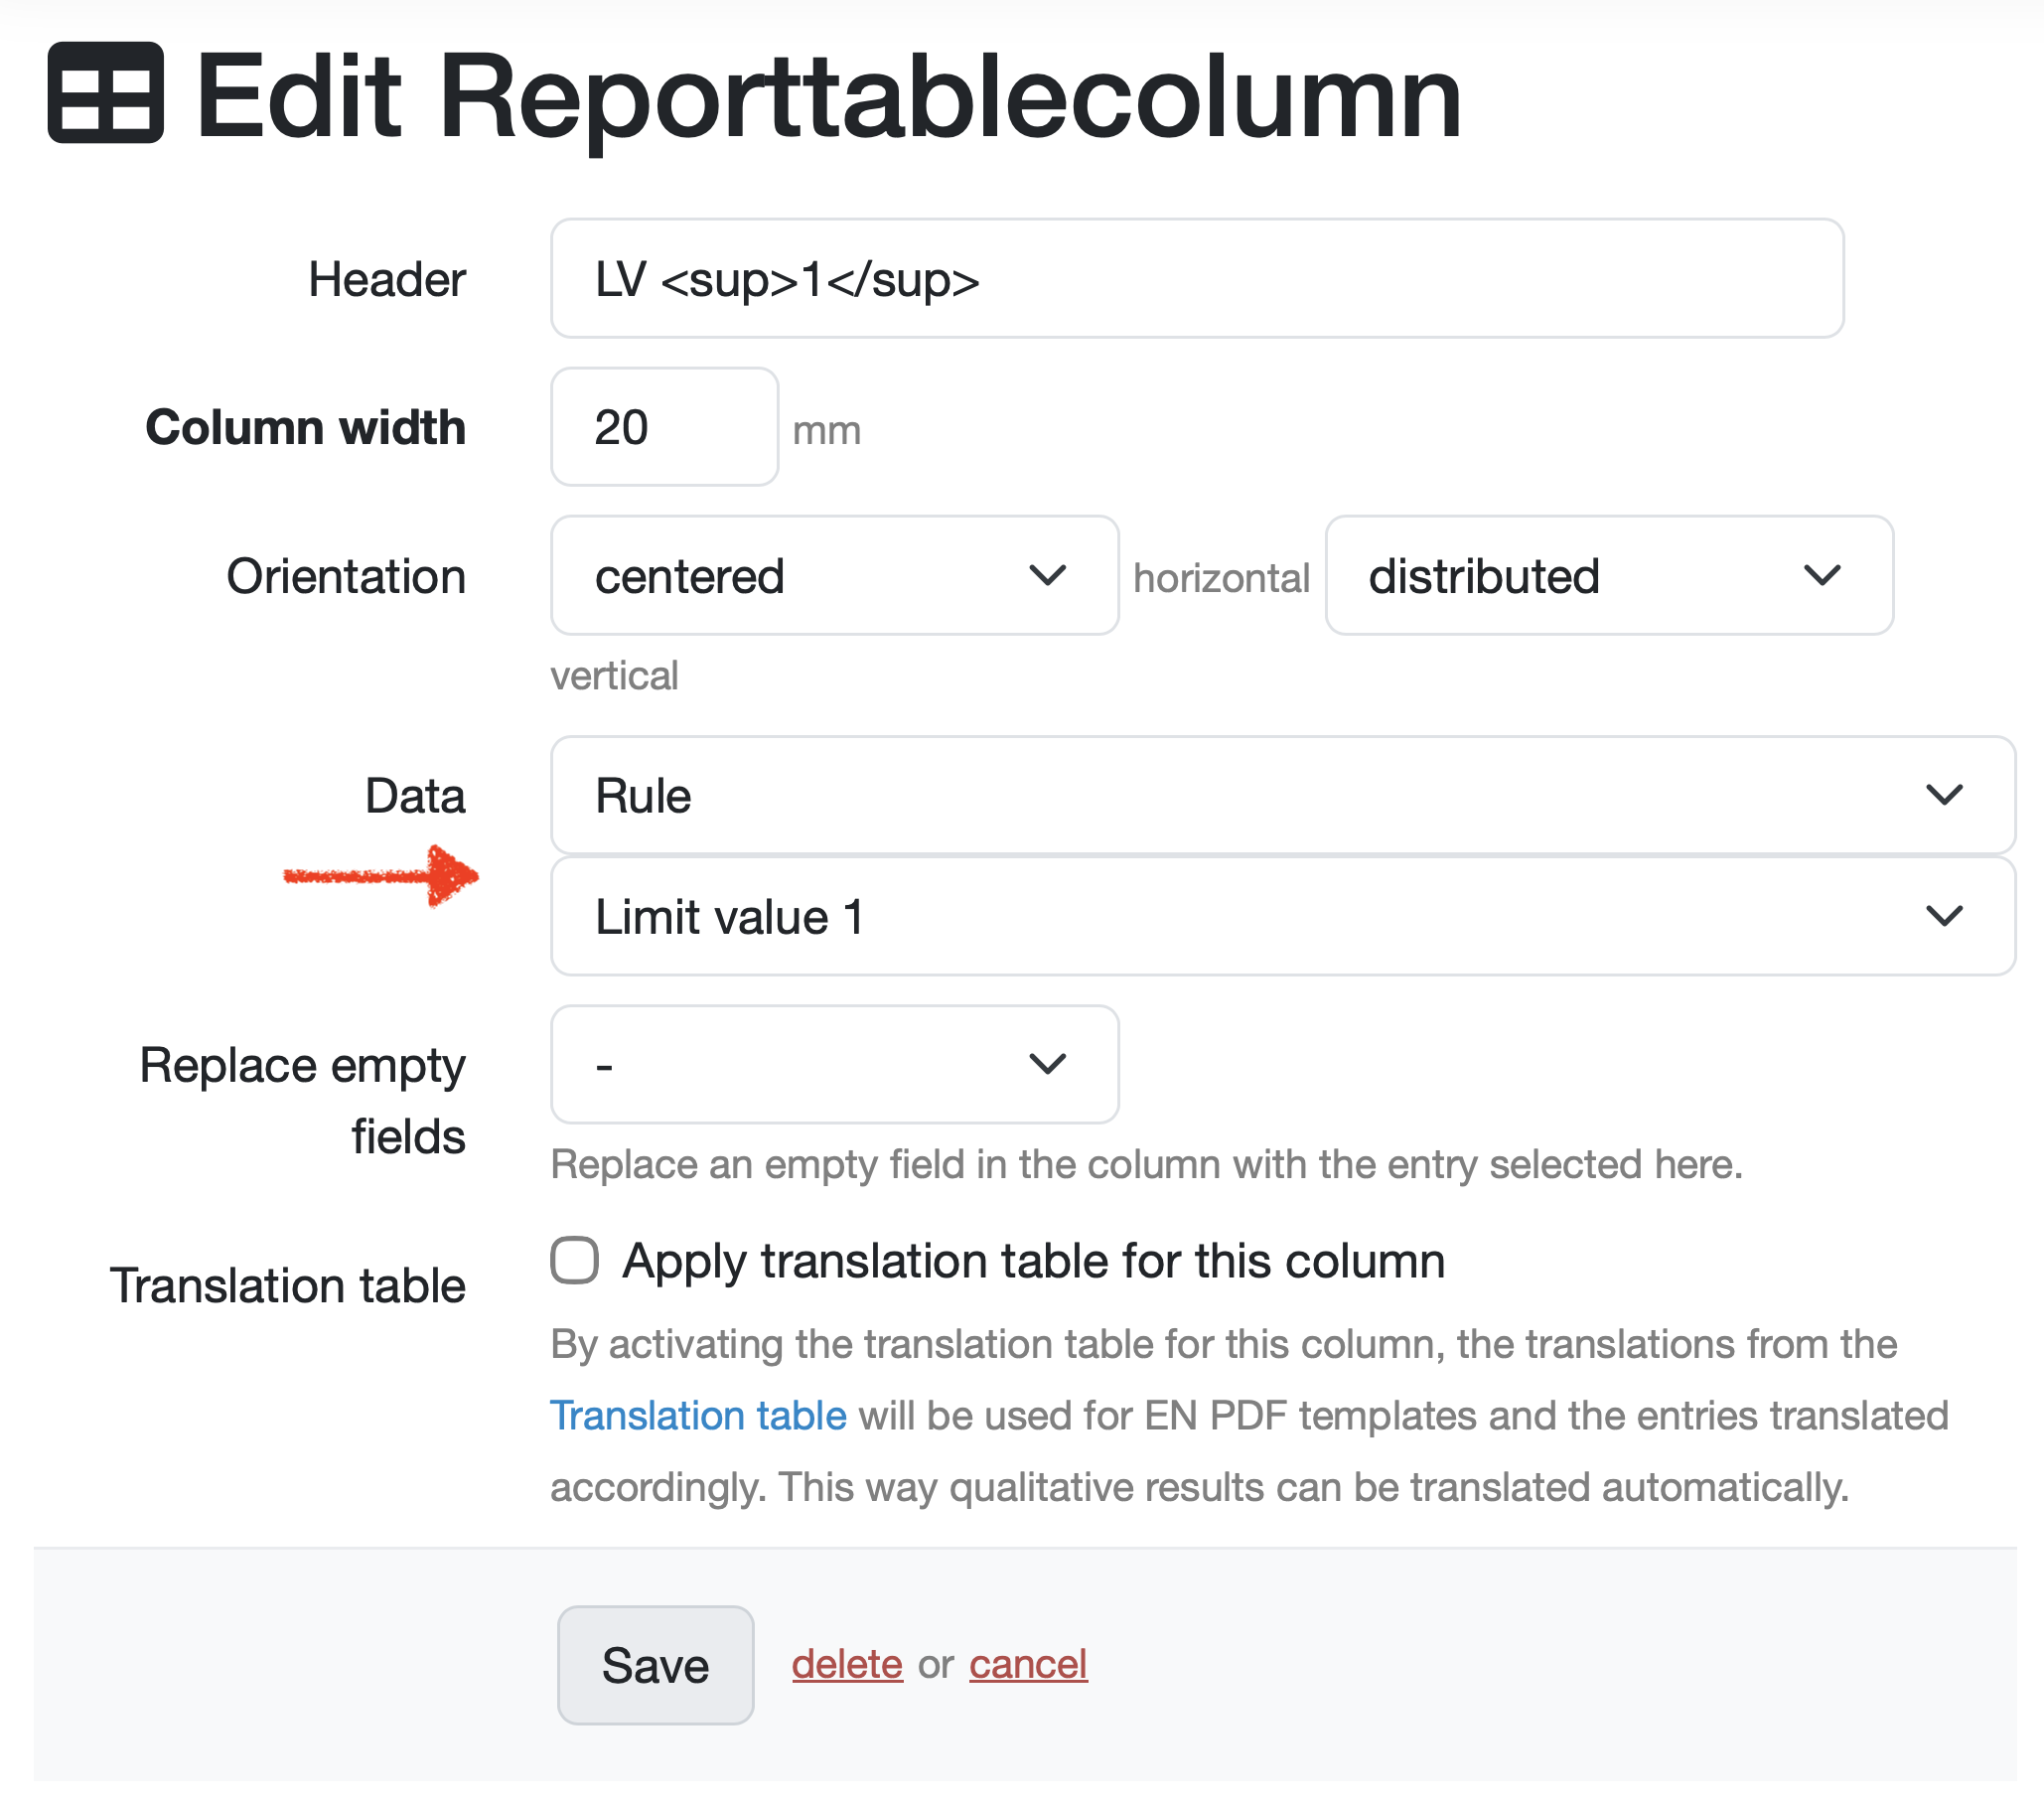
3.1. Select the data Rule, to reflect the configured set value (Limit value 1 in this example) of the respective parameter.
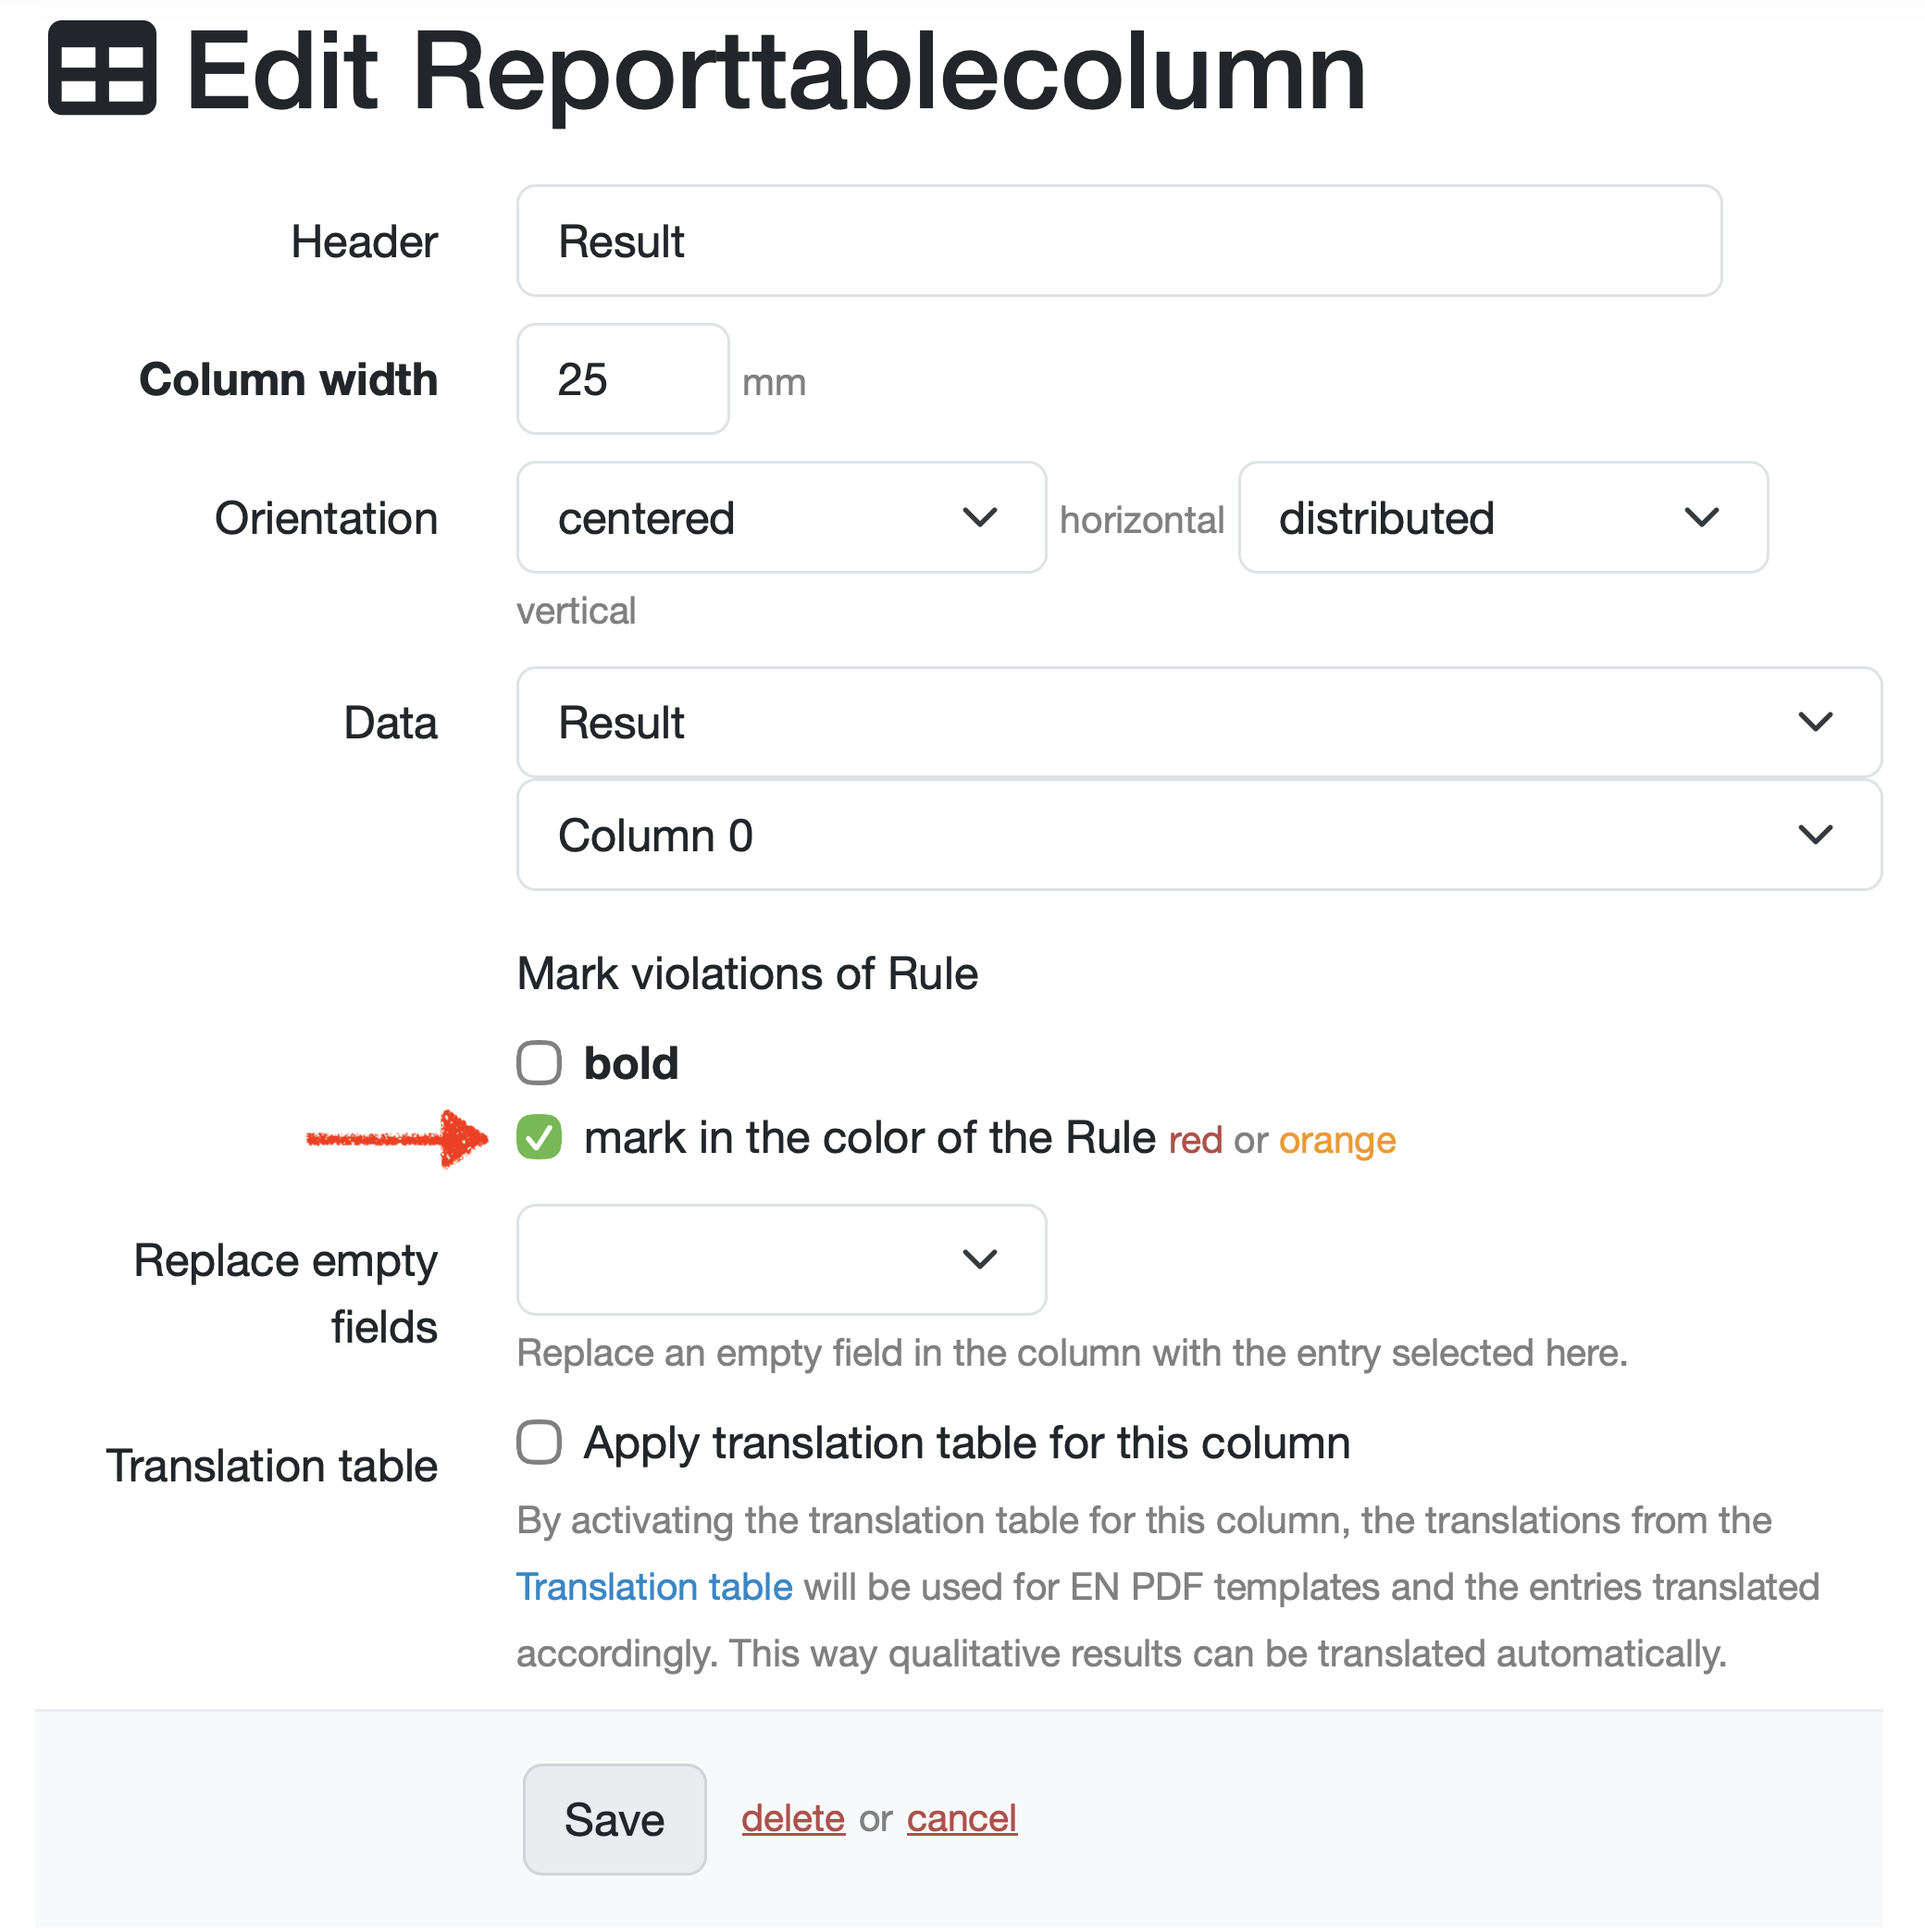
3.2. If you want to highlight target value violations in results, select either the Mark in the color of the rule red or orange or bold check box for the results column.
Laatste wijziging: 21.08.2026
Algemeen
Leveranciersbeoordeling
Materiaal
Medewerkers
Klanten
Opdrachten
Monsters
PDF-sjablonen
Bijlagen
Recepten
Verslagen
Editor voor rapporttabellen
Interfaces
Kompetenzen
AI-functies
Inleidende fase
Analyses
Sjablonen
Klantenportaal (optioneel)
Aanbiedingen
Facturen
Parameters
Rekenwerk met parameters
Webservices
Transformatiecode
Controleplannen / Grenswaarden / Specificaties
Documentbeheer
Vragen en antwoorden
Testmiddelen
Opleidingen voor medewerkers
8D-rapport
Overige
Bestandsbeheer
Processen