You can access the chart view via:
Navigation bar → Samples → Sample list → Results table → Click on parameter abbreviation
Alternatively, you can access the statistics directly from a specification.
The chart view enables:
The page is divided into four areas:
These areas are described below.
In the configuration panel, you select the parameters to be displayed and an optional specification.
1st–4th Parameter
Up to four parameters can be configured per chart. Two dropdown fields are available for each parameter:
Note: The 2nd, 3rd and 4th parameter selections are optional. If no second parameter is selected, the correlation diagram and the second histogram tab are not available.
Specification
Display
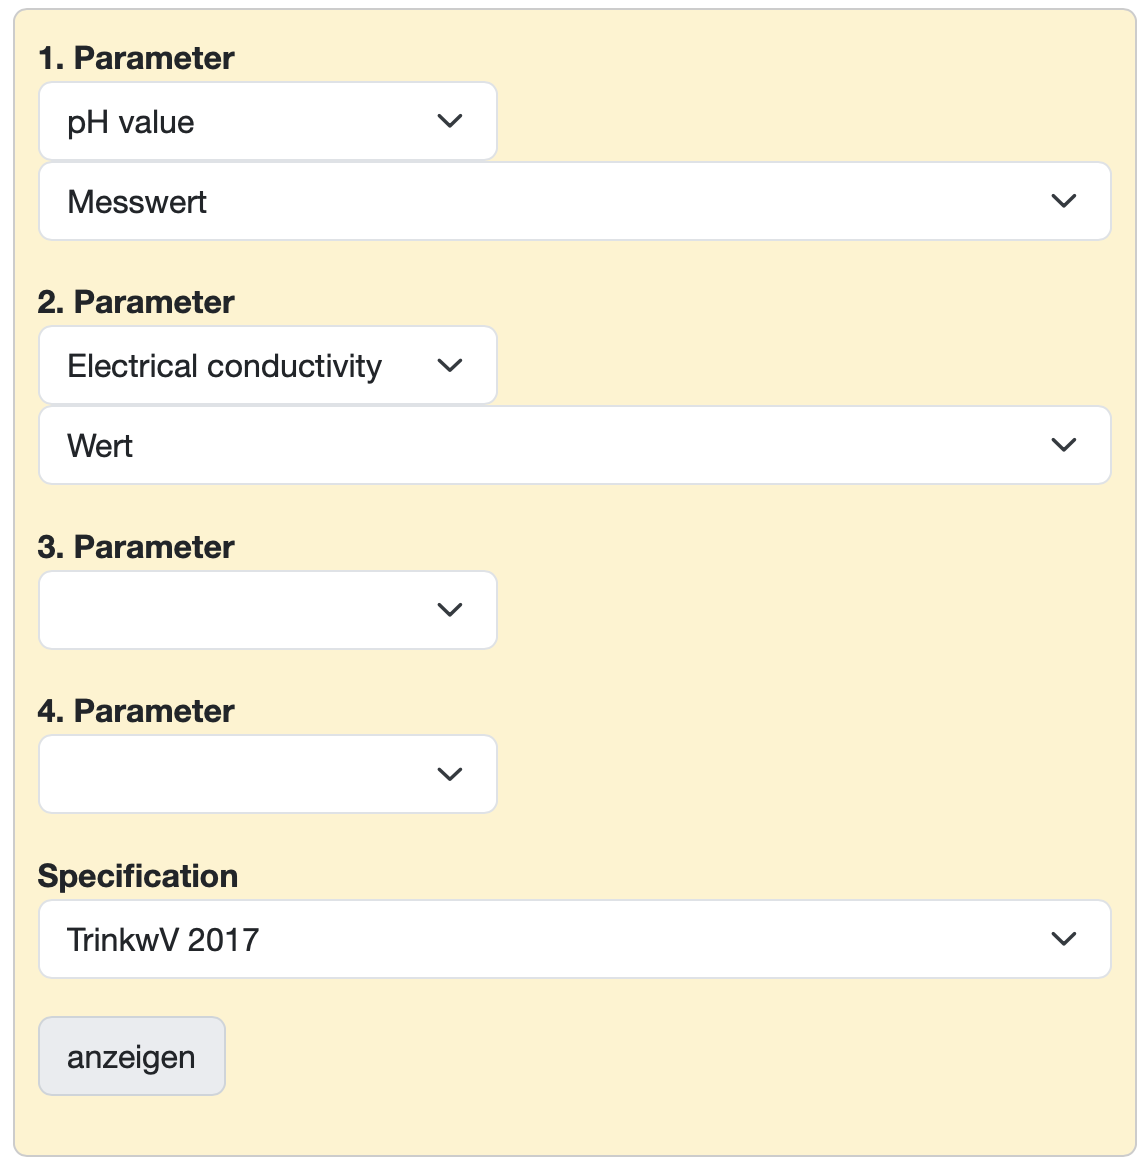
Figure: Configuration panel
For each configured parameter, the statistical key figures are displayed in a tabular overview in the top right.
| Key figure | Description |
|---|---|
| Samples | Number of evaluated samples with an existing measured value |
| min | Smallest measured value |
| max | Largest measured value |
| Mittelwert | Arithmetic mean of all measured values |
| StDev.S | Sample standard deviation |
| Sollwert Max | Upper specification limit (USL), if a specification is selected |
| Sollwert Min | Lower specification limit (LSL), if a specification is selected |
| Cp | Process capability index (only if specification limits are available) |
| CpK | Critical process capability index (only if specification limits are available) |
Depending on the parameter configuration, several chart types are available as tabs below the configuration panel.
The Chart tab displays the trend of measured values across all samples found as a line chart.
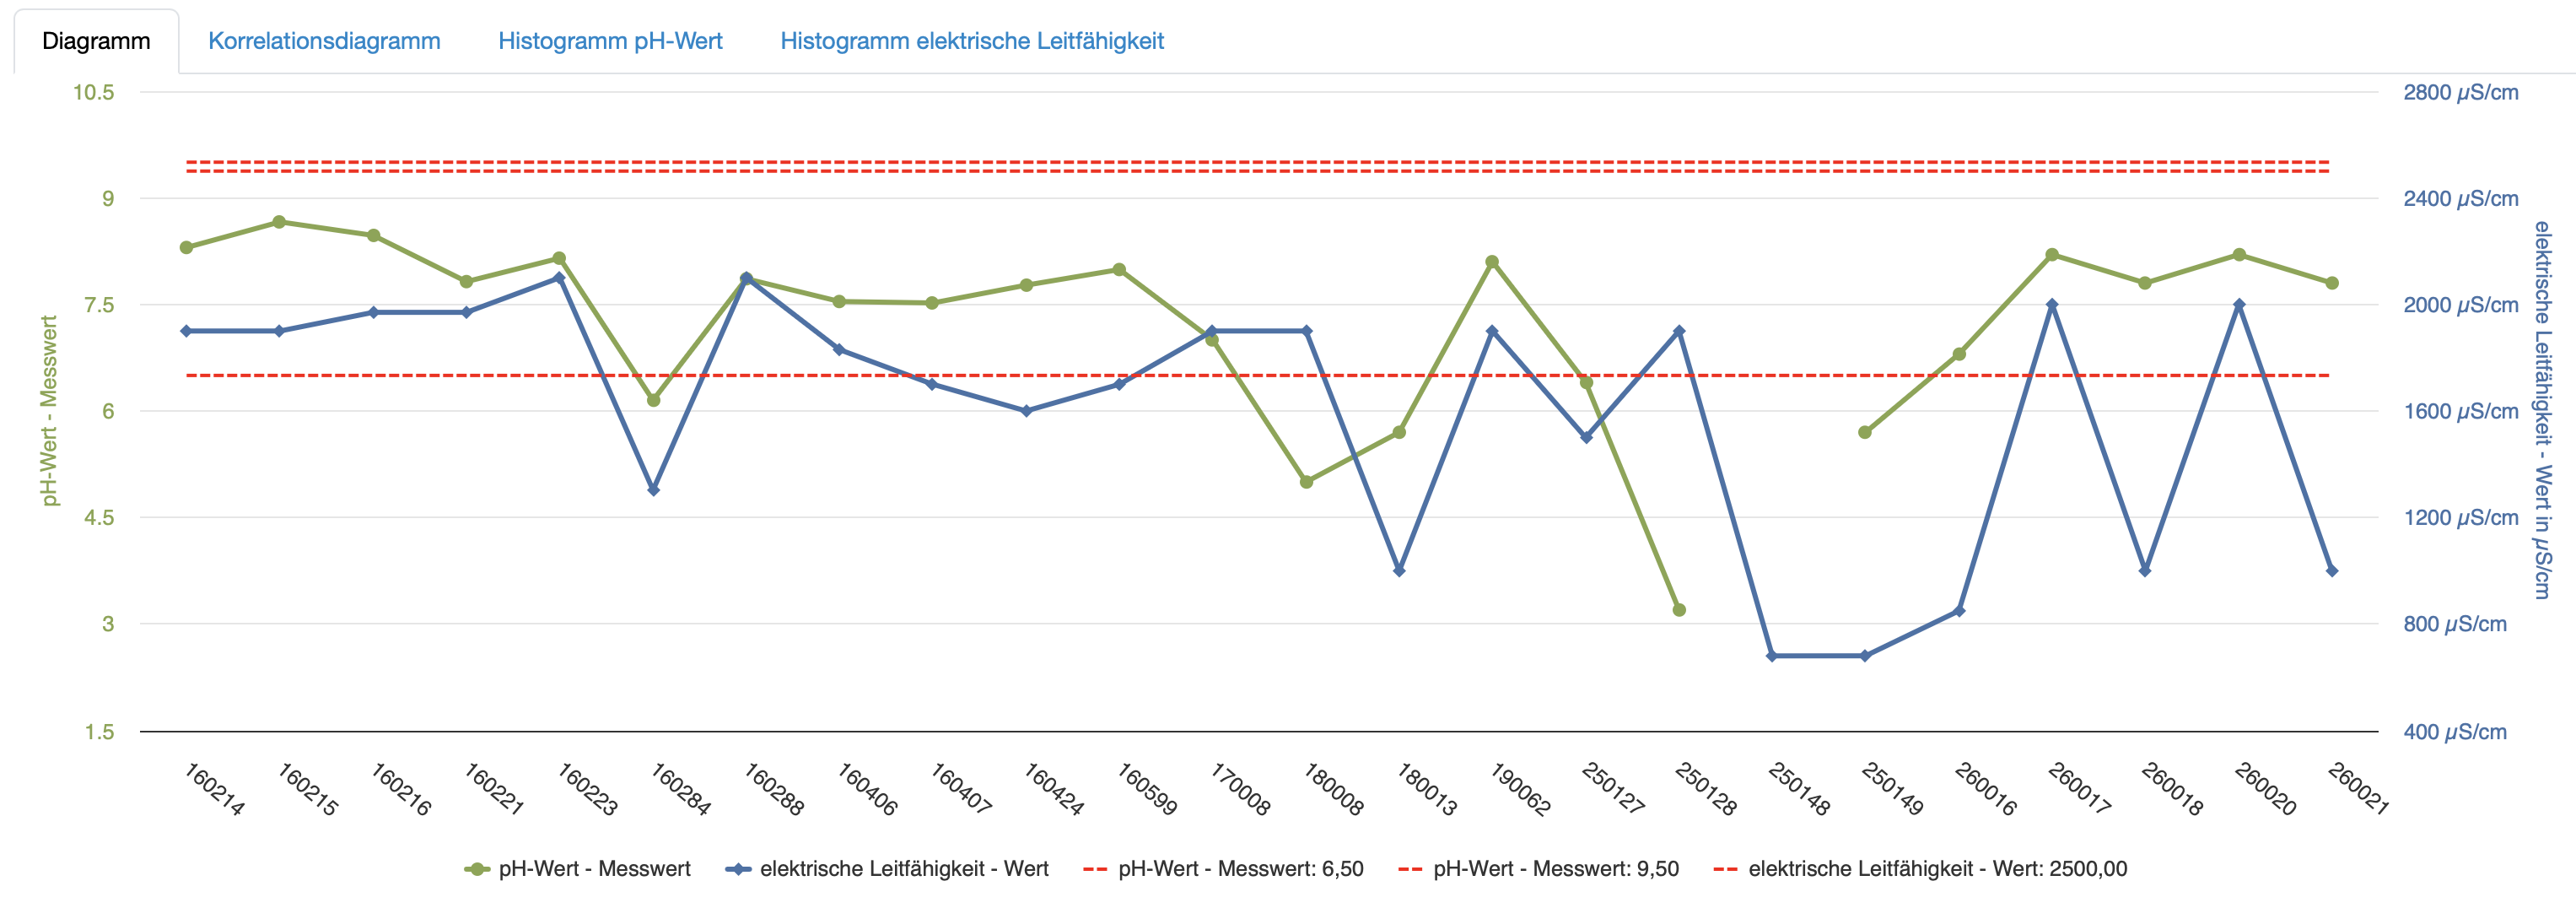
Figure: Line chart
The Correlation Diagram tab is available as soon as at least two parameters are selected. It displays the measured values of both parameters as a correlation diagram (scatter plot) with Pearson correlation and regression line.
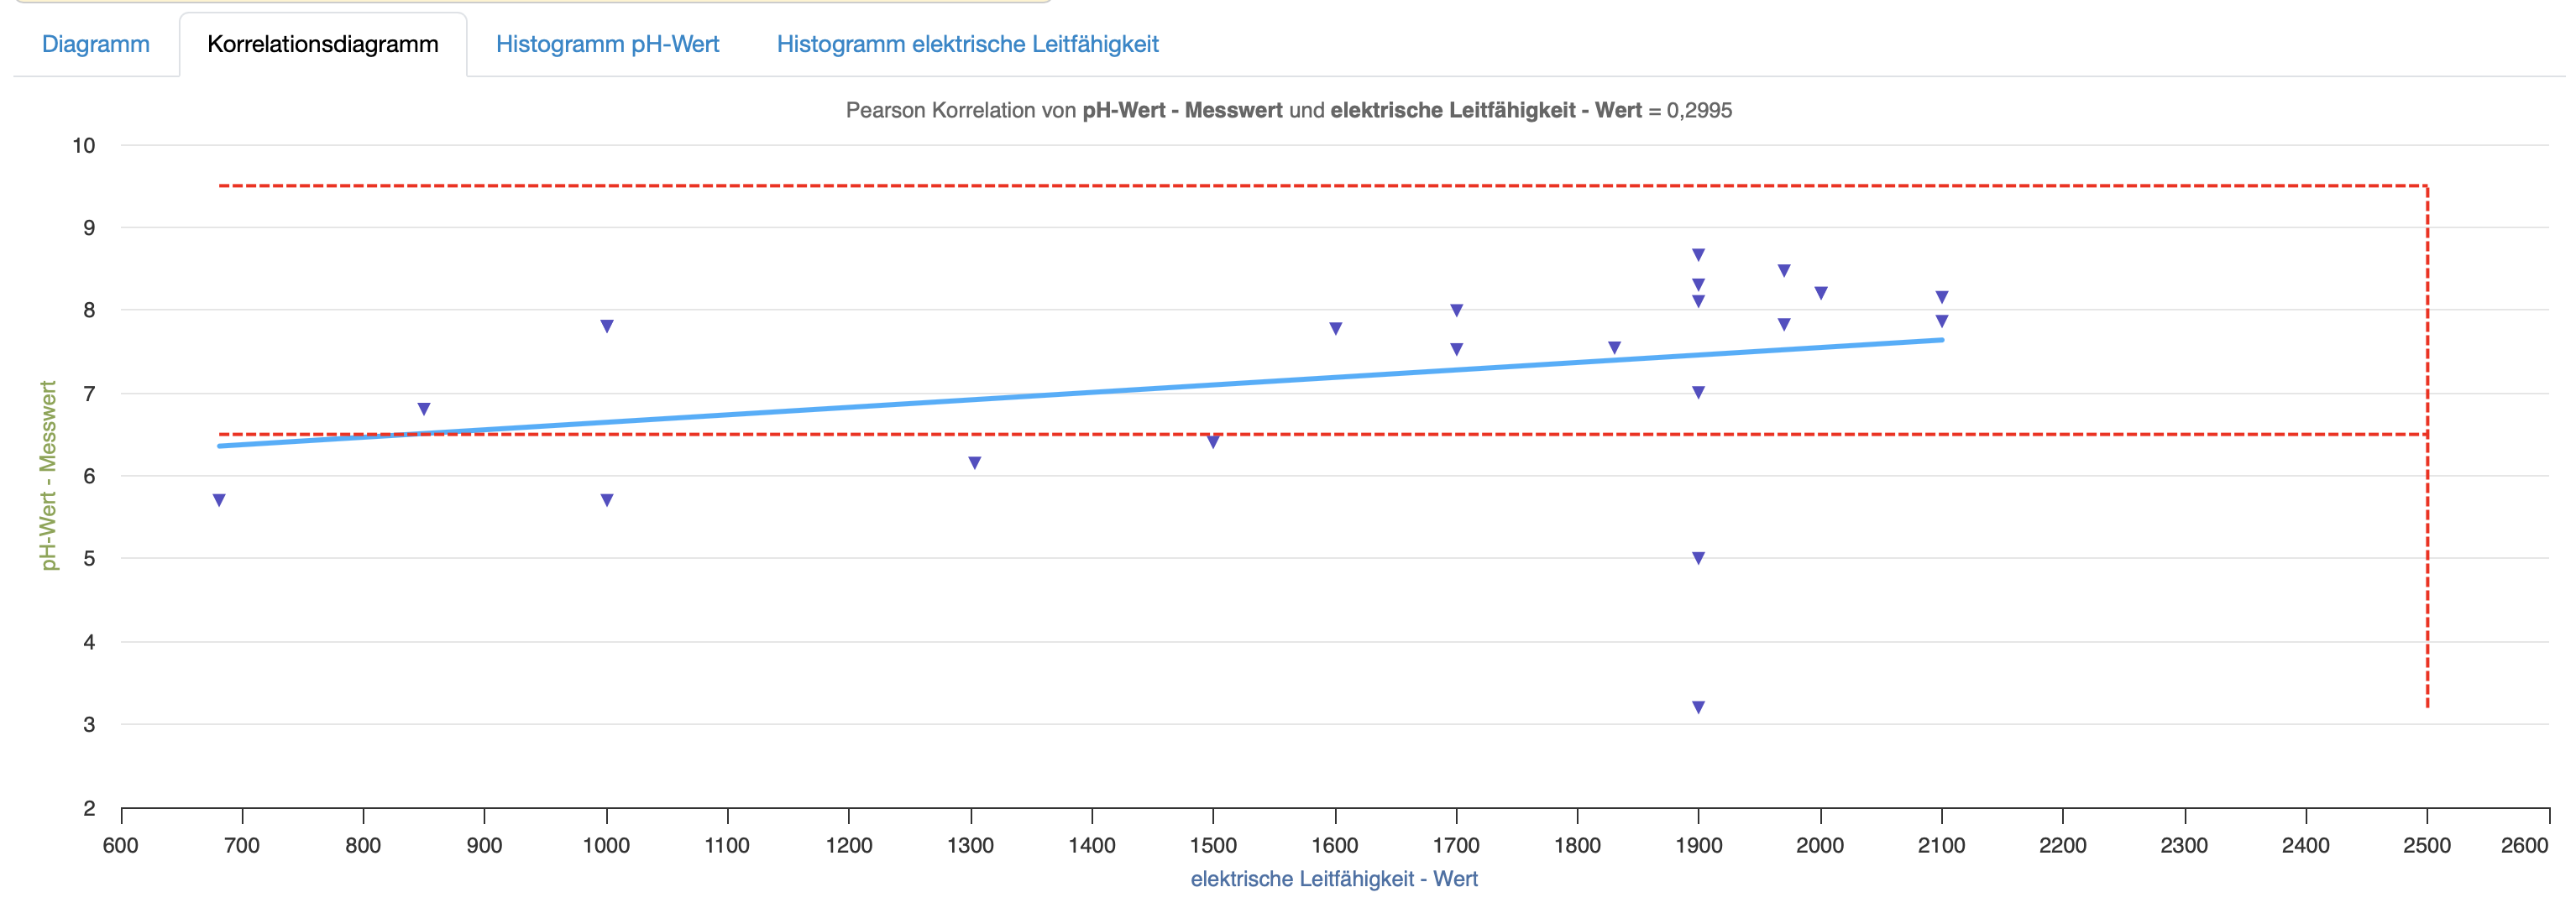
Figure: Correlation diagram
A separate histogram tab is available for each selected parameter.
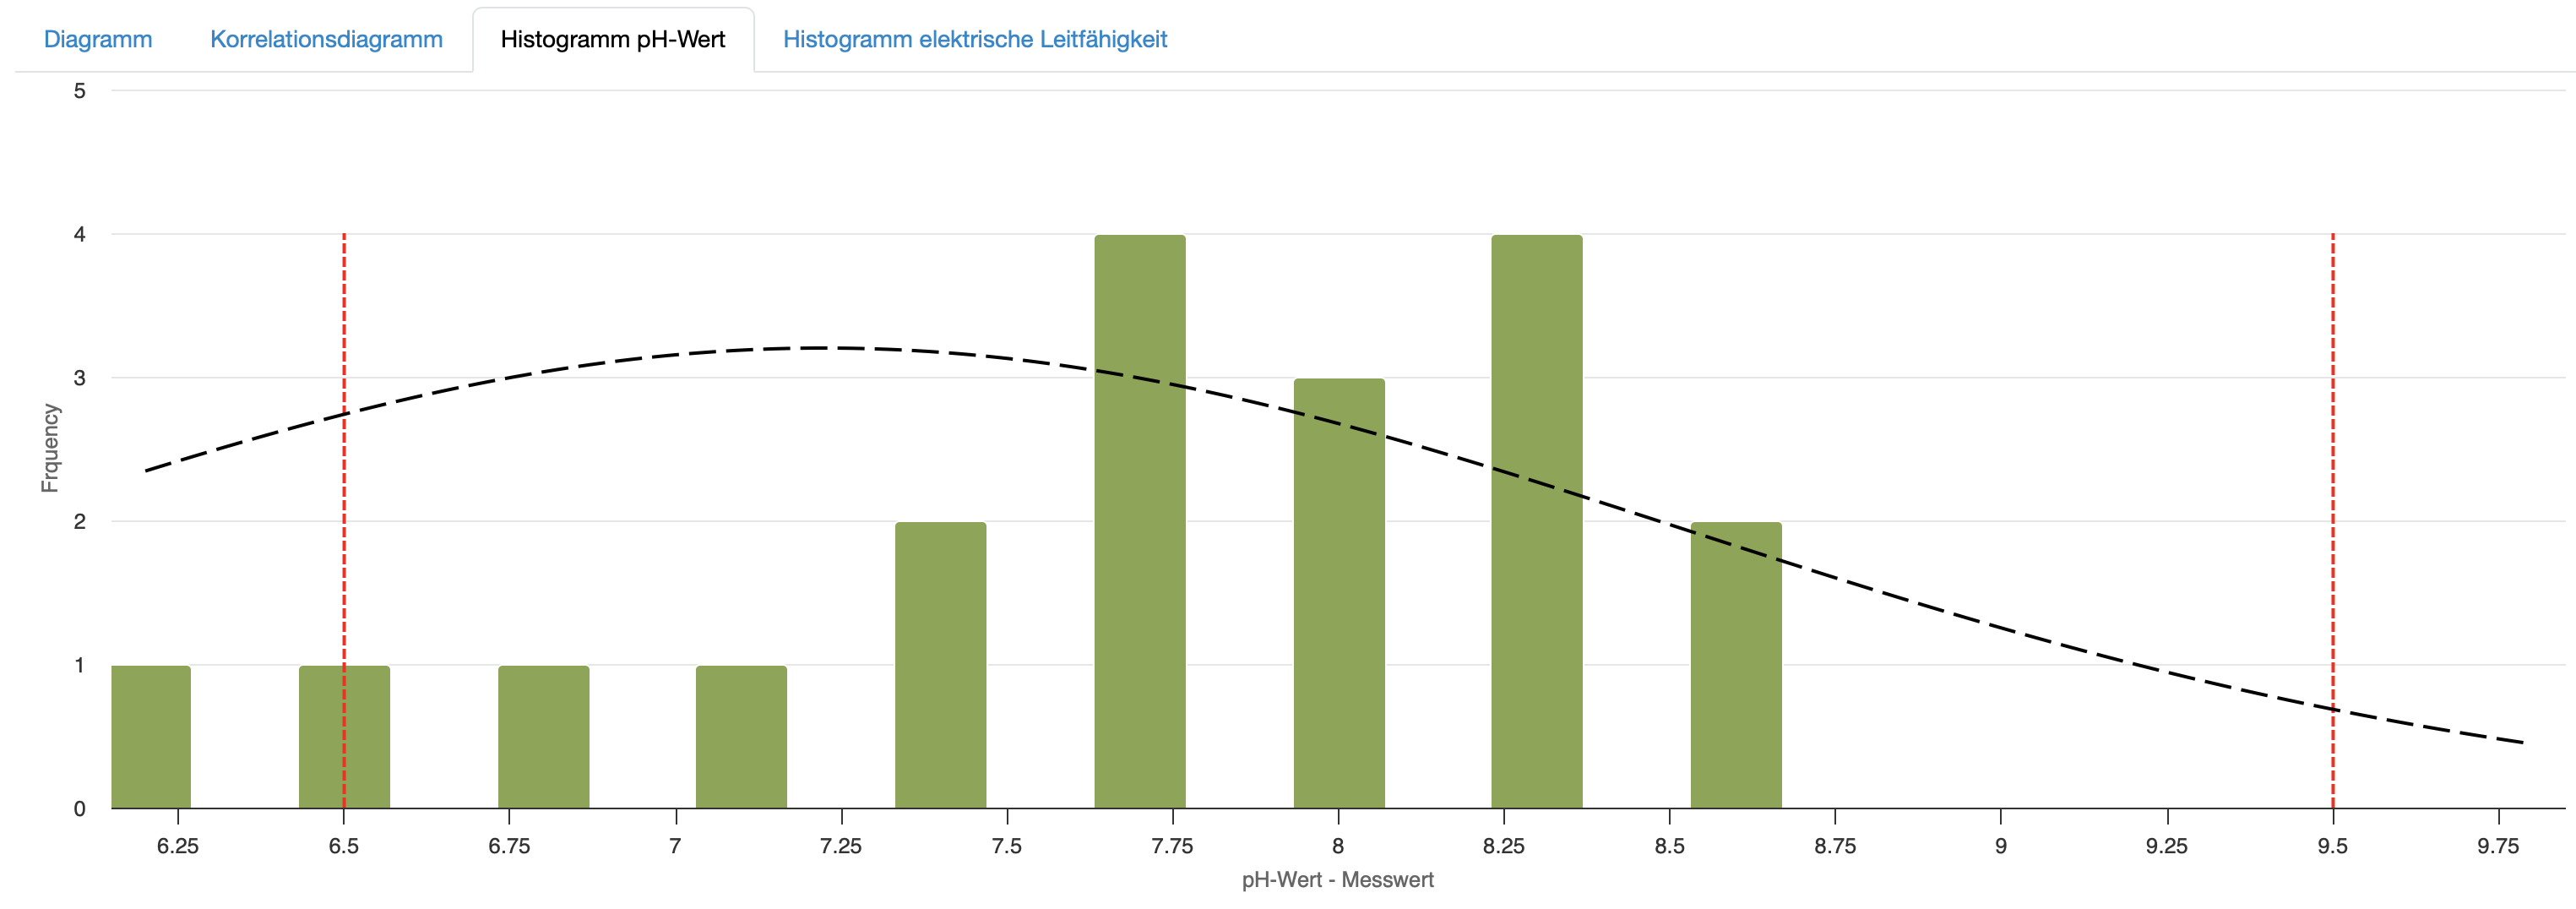
Figure: Histogram
A tabular overview of all samples found is displayed below the chart area.
| Column | Description |
|---|---|
| Sample | Sample number as a clickable link to the sample detail view |
| Date | Entry date of the sample |
| Parameter name, unit | Measured value of the respective parameter for this sample; one column per configured parameter |
You can compile statistics from the entire database in three steps.
Step 1: Filter samples
Step 2: Open results table
Step 3: Open statistics
Laatste wijziging: 21.08.2026
Algemeen
Leveranciersbeoordeling
Materiaal
Medewerkers
Klanten
Opdrachten
Monsters
PDF-sjablonen
Bijlagen
Recepten
Verslagen
Editor voor rapporttabellen
Interfaces
Kompetenzen
AI-functies
Inleidende fase
Analyses
Sjablonen
Klantenportaal (optioneel)
Aanbiedingen
Facturen
Parameters
Rekenwerk met parameters
Webservices
Transformatiecode
Controleplannen / Grenswaarden / Specificaties
Documentbeheer
Vragen en antwoorden
Testmiddelen
Opleidingen voor medewerkers
8D-rapport
Overige
Bestandsbeheer
Processen