
Ines Weiher
Pharma Food

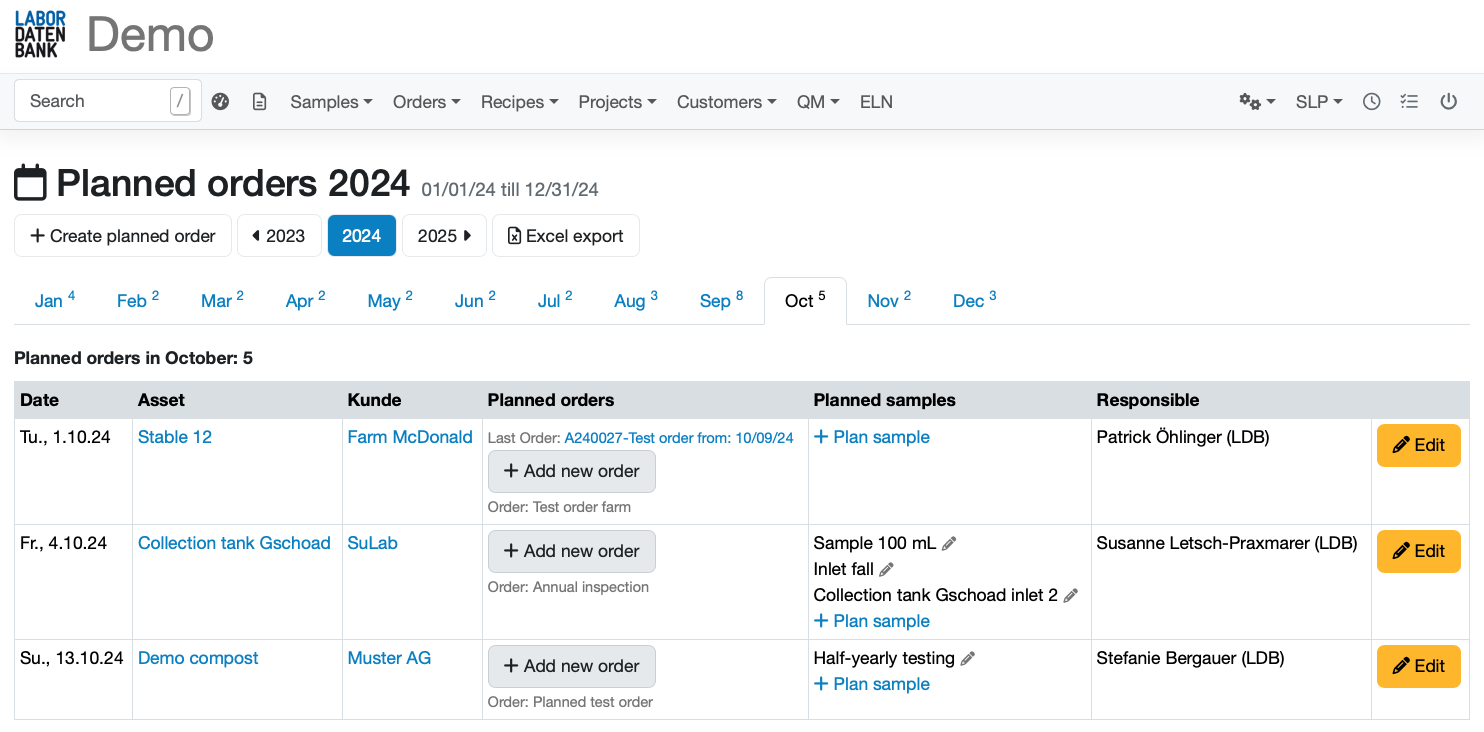


in 6 different industries
in 12 countries across Europe & the US
from the best labs in Europe
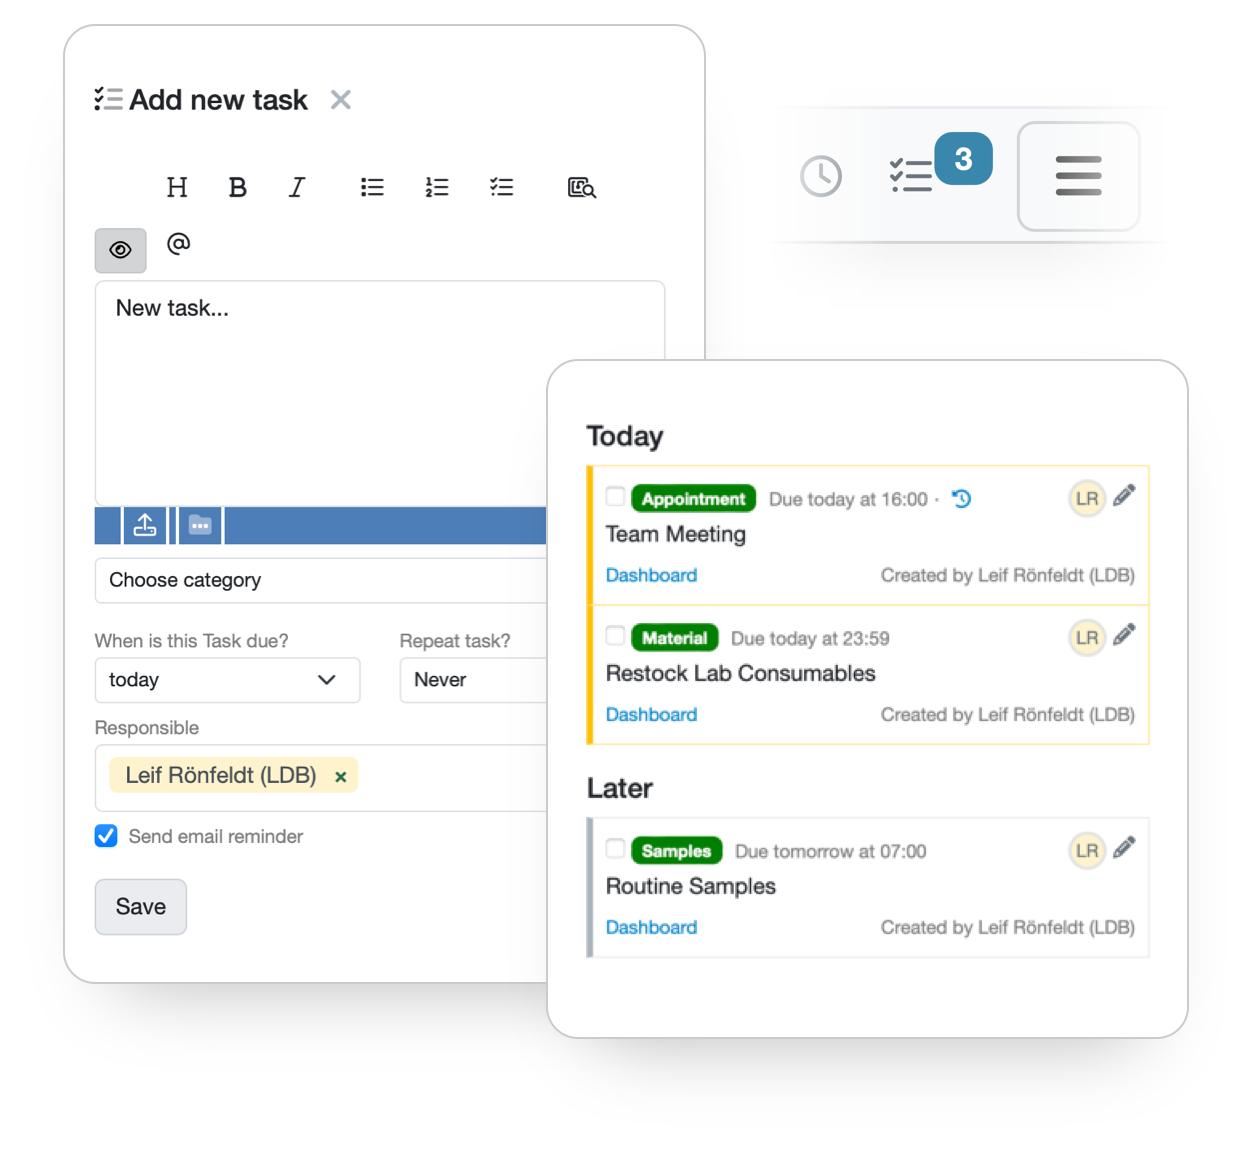
Assign tasks to individual team members and monitor their progress
model and track your workflows via comprehensive status management for each sample
Restrict Access and features to specific user roles
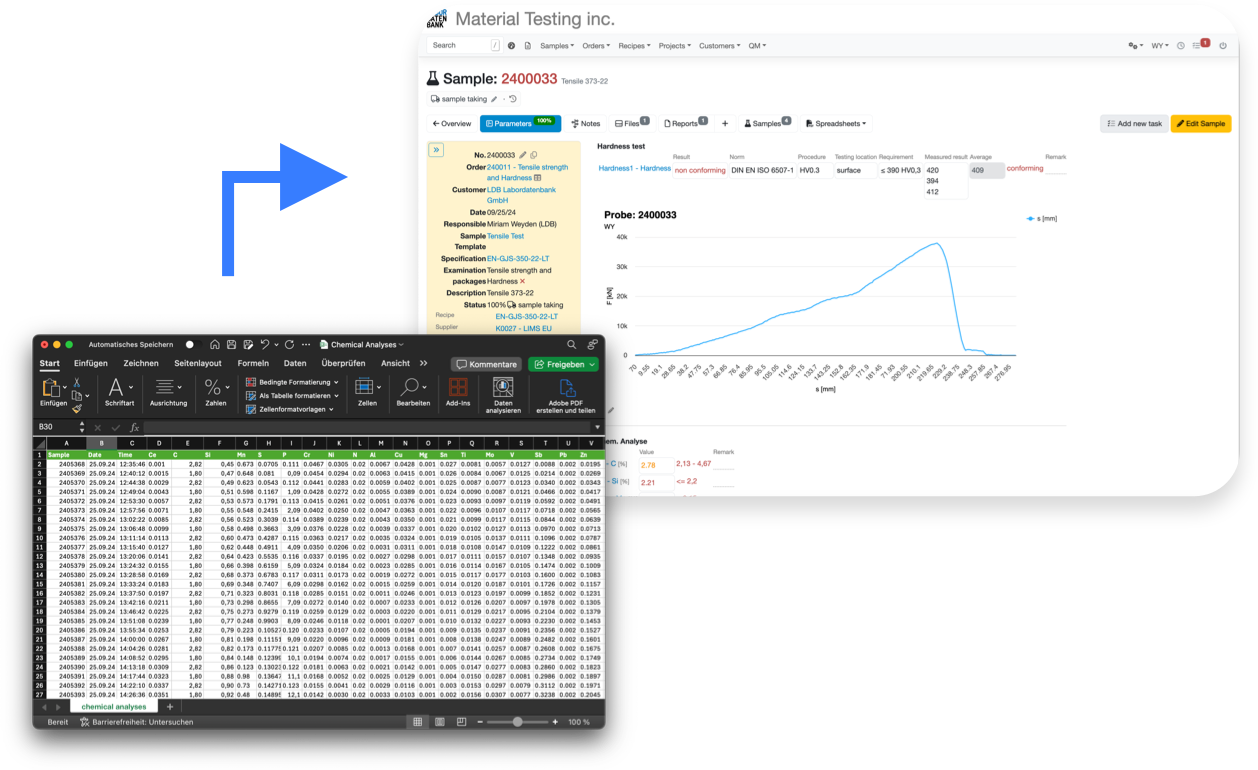
Data exchange via file upload, FTP, HTTP or even Mail available at the click of a button
import csv, json, txt, hl7, xml, fhir, gdt, chromelion, animl, shapth and many more. As long as it contains text data, LIMS.eu has you covered.
you can freely structure your data as you see fit, LIMS.eu can handle it
Even complex data structures can conveniently be transformed using the full power of javascript
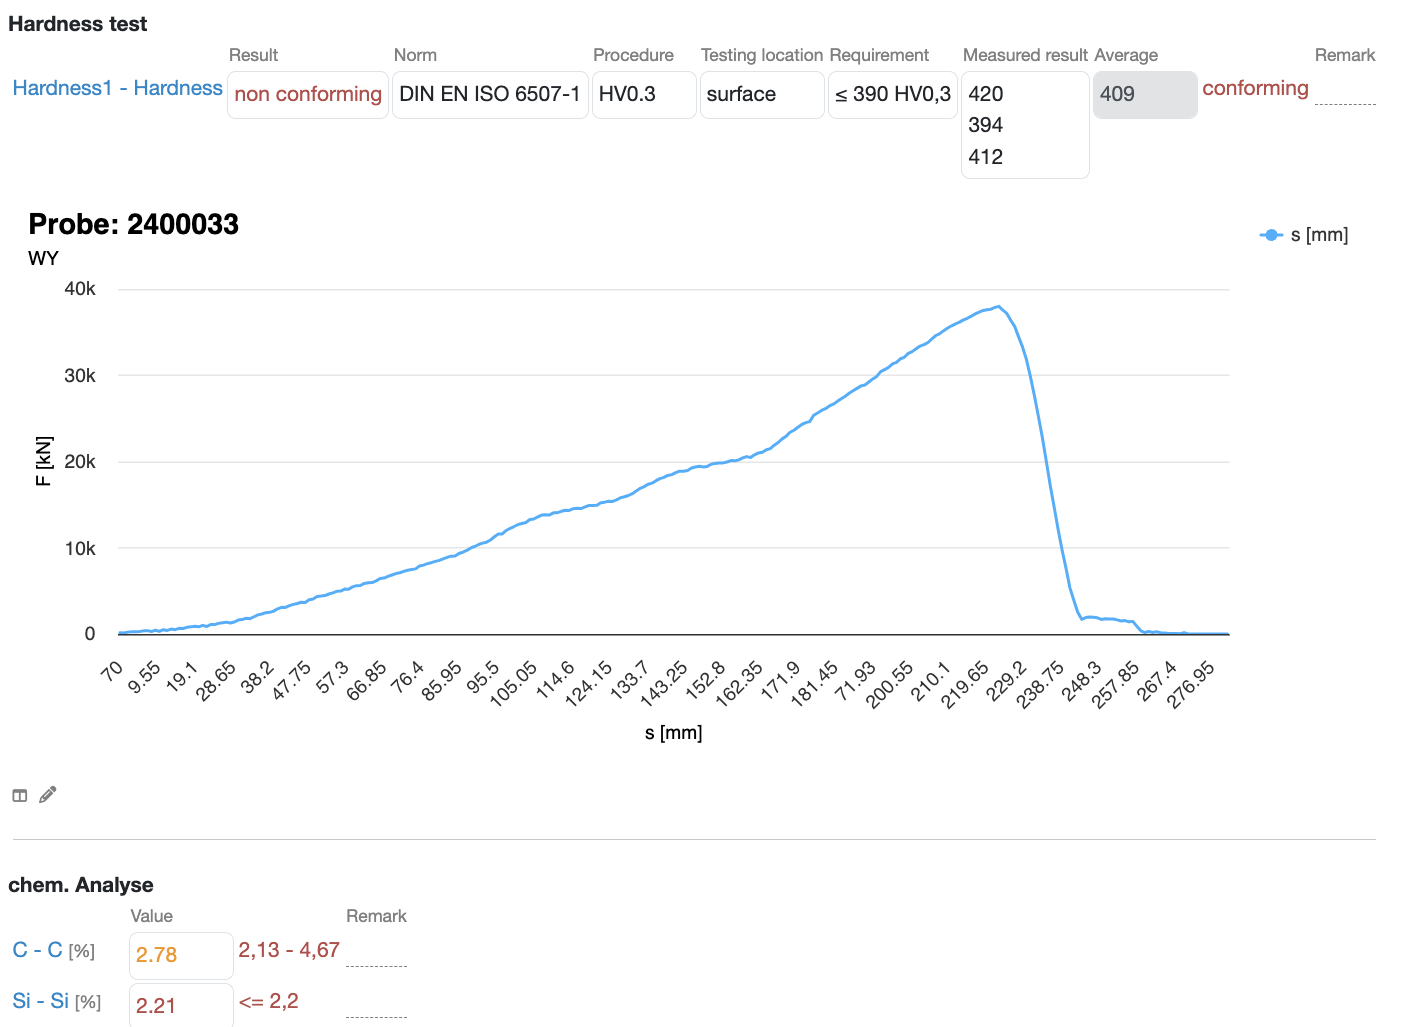
Automatically check against threshholds for different interpretations and highlight nonconforming samples
Build complex formulas using intuitive excel-like syntax to combine values from different parameters and transform them according to your needs
Conveniently visualize your analysis data with flexible charts and diagramms
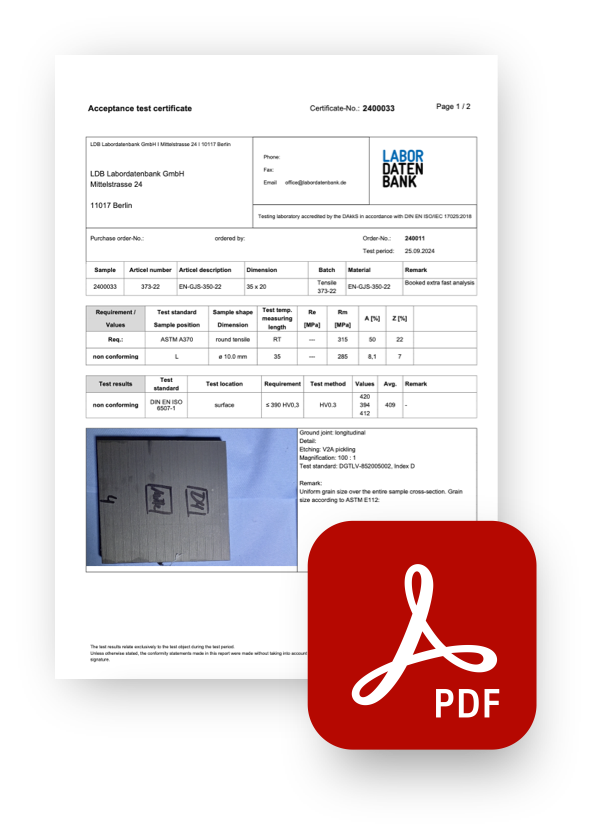
Test results can be linked to coresponding text-modules, allowing you to automatically create comprehensive reports for every sample without having to write a single word.
Create different report-templates containing all of your data, as well as images, charts and visualizations - all styled to your liking using our no-code editor
Provide your customers a secure and convenient way to access their results & reports via an intuitive web interface
Test reports are signed according to ETSI EN 319 142, can be validated online and are legally binding
5
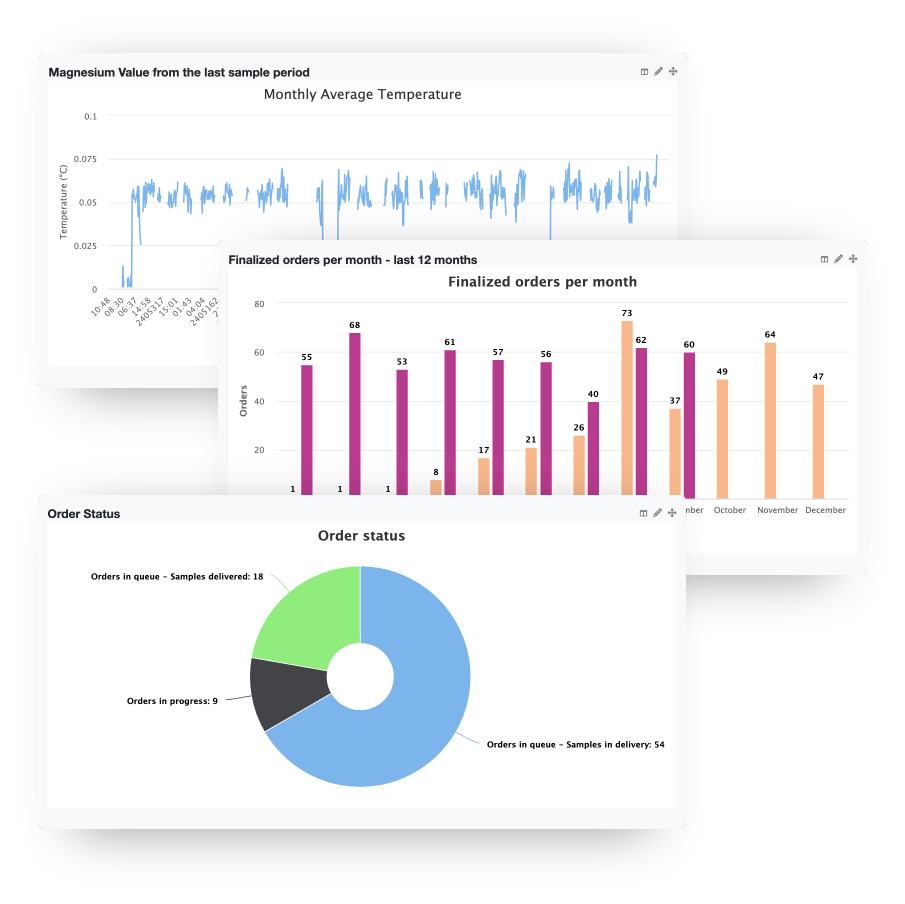
Effiently manage your lab using beautiful and comprehensive dashboards that allow you to gain insights into all relevant metrics for your lab at a glance
Analyze all the of the data your lab produces and make in useable and understandable using powerful charts and visualizations
Create custom views and widgets tailored to specific users or user groups and restrict access using our comprehensive rights management
LIMS.eu runs on AWS, the leading cloud provider, on multiple availability zones in Frankfurt and guaranties best-in-class availability.
All data is securely encrypted and stored on servers within europe to ensure maximum compliance, security and data integrity.
Authentication is secured by your choice of Single-Sign-On (SSO) and/or multi factor authentication (MFA).
We regularly audit all of our systems, both internally and externally, to ensure maximum security.
Development and operation of LIMS.eu is ISO 27001 certified by TÜV Rheinland.
All data entries and changes in your system are thoroughly documented in an integrated audit trail.

Pharma Food

Food Veterinary

Automotive QMMaterial

Water EnvironmentQM
Our entire support team consists of LIMS experts with a scientific background and many years of laboratory experience. We continuously support you and help you implemt the perfect processes and automations for your specific workflows
CEO
Head of service analytics food/water
CEO & Lab manager